Axis Ranging - Restricting VisibleRange
Clipping the Axis VisibleRange on Zoom and Pan using the VisibleRangeLimit
Given a chart with data in the range of [0, 10], when you zoom to extents, the axis will have a VisibleRange of [0, 10]. Sometimes this is not desirable, and you want to clip the setVisibleRange(IRange visibleRange) inside the data-range.
To do this, you can use the visibleRangeLimit property.
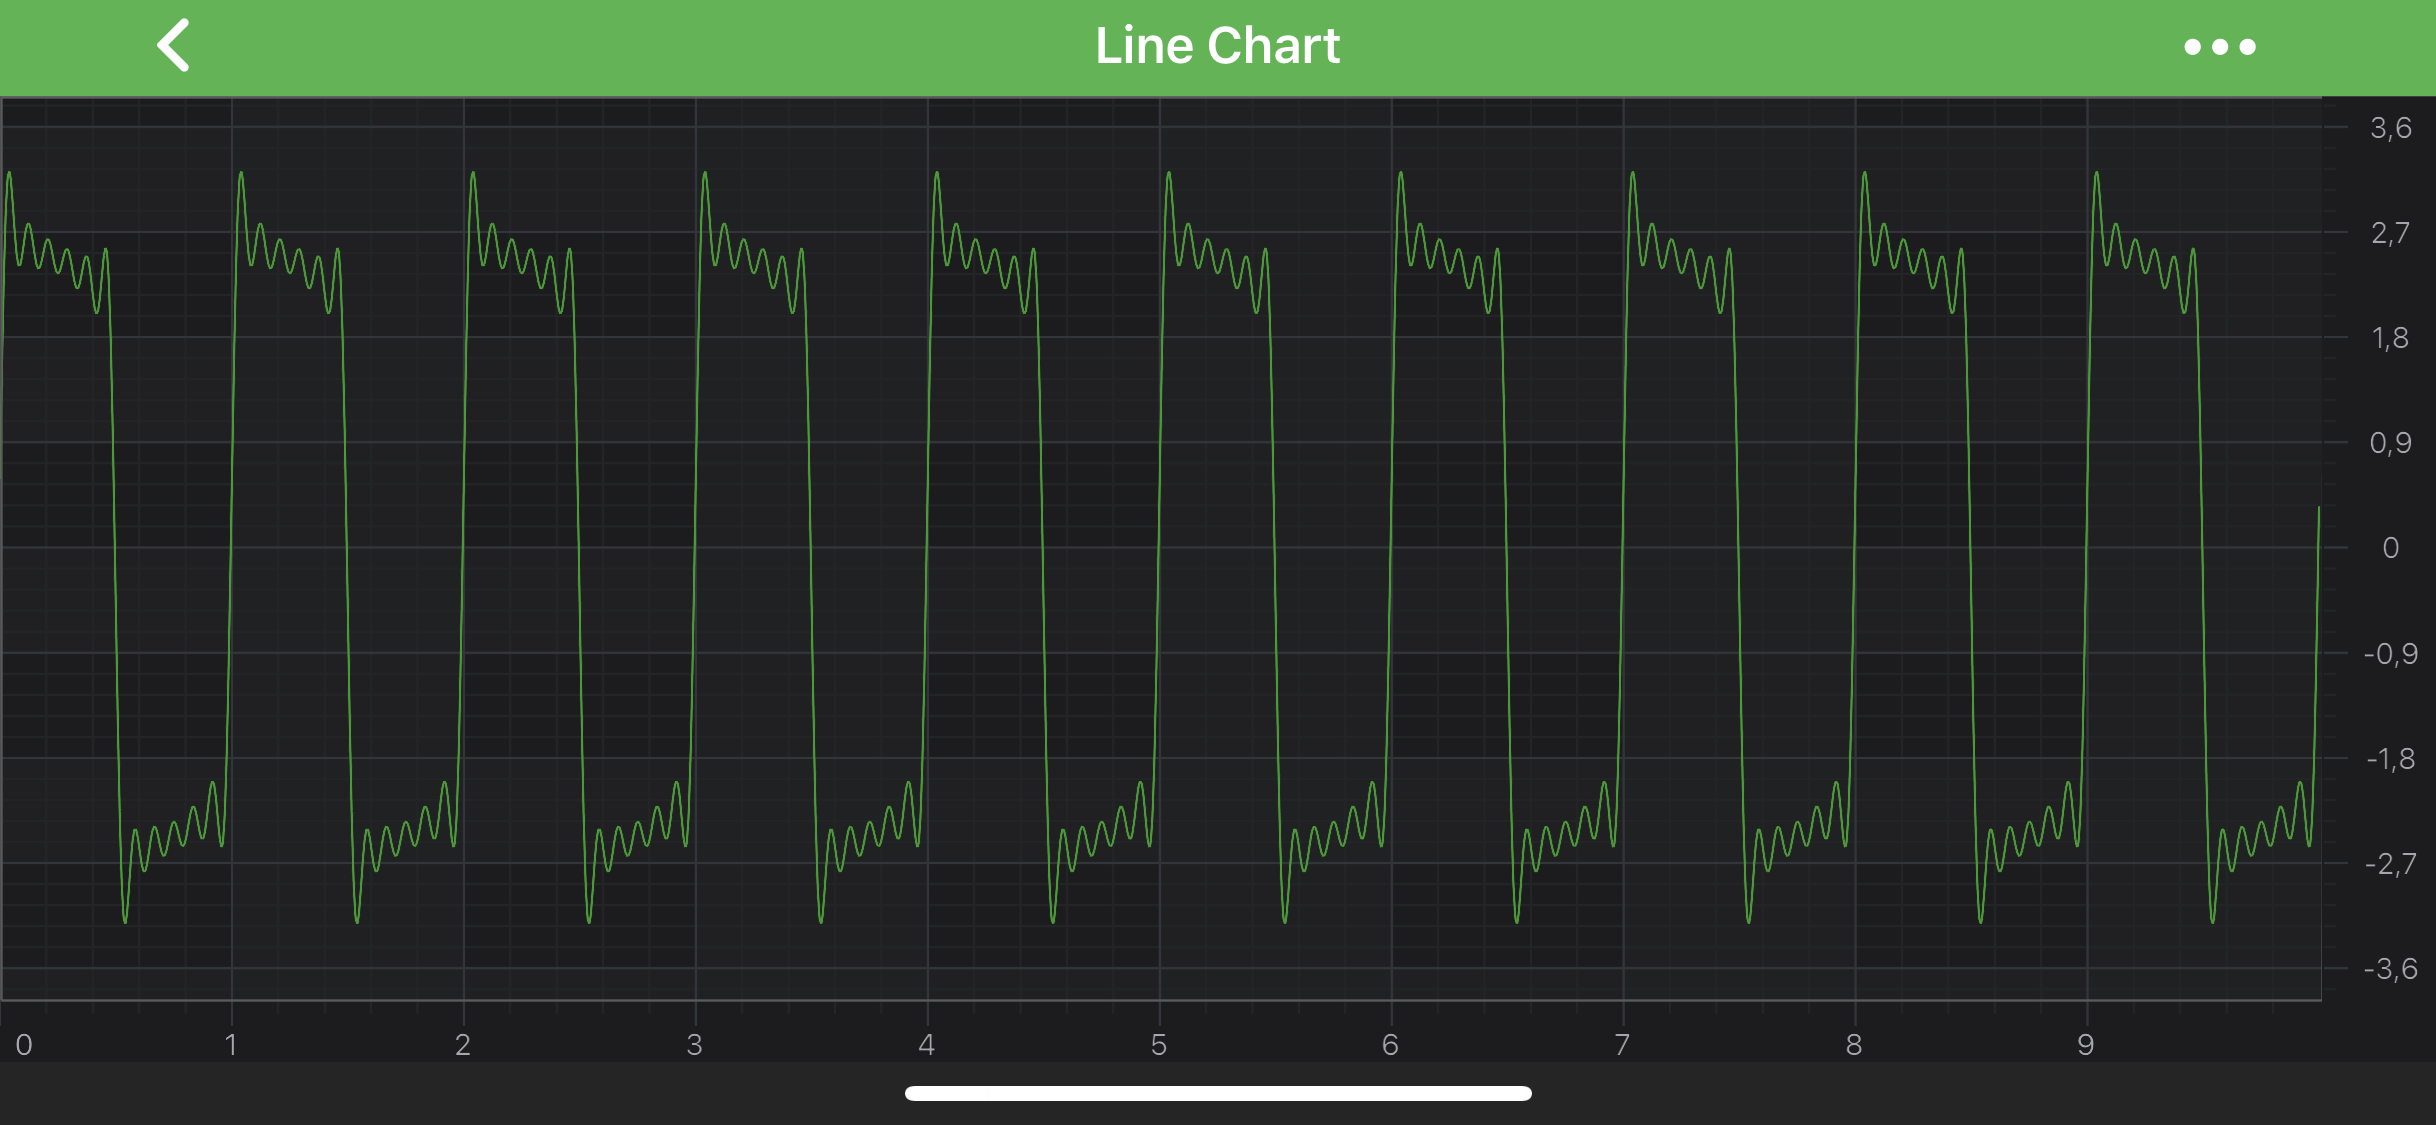
For example. Given an axis without any limits (visibleRangeLimit = nil). When we perform ZoomExtents on the chart, the XAxis gets the visible range [0, 10]:
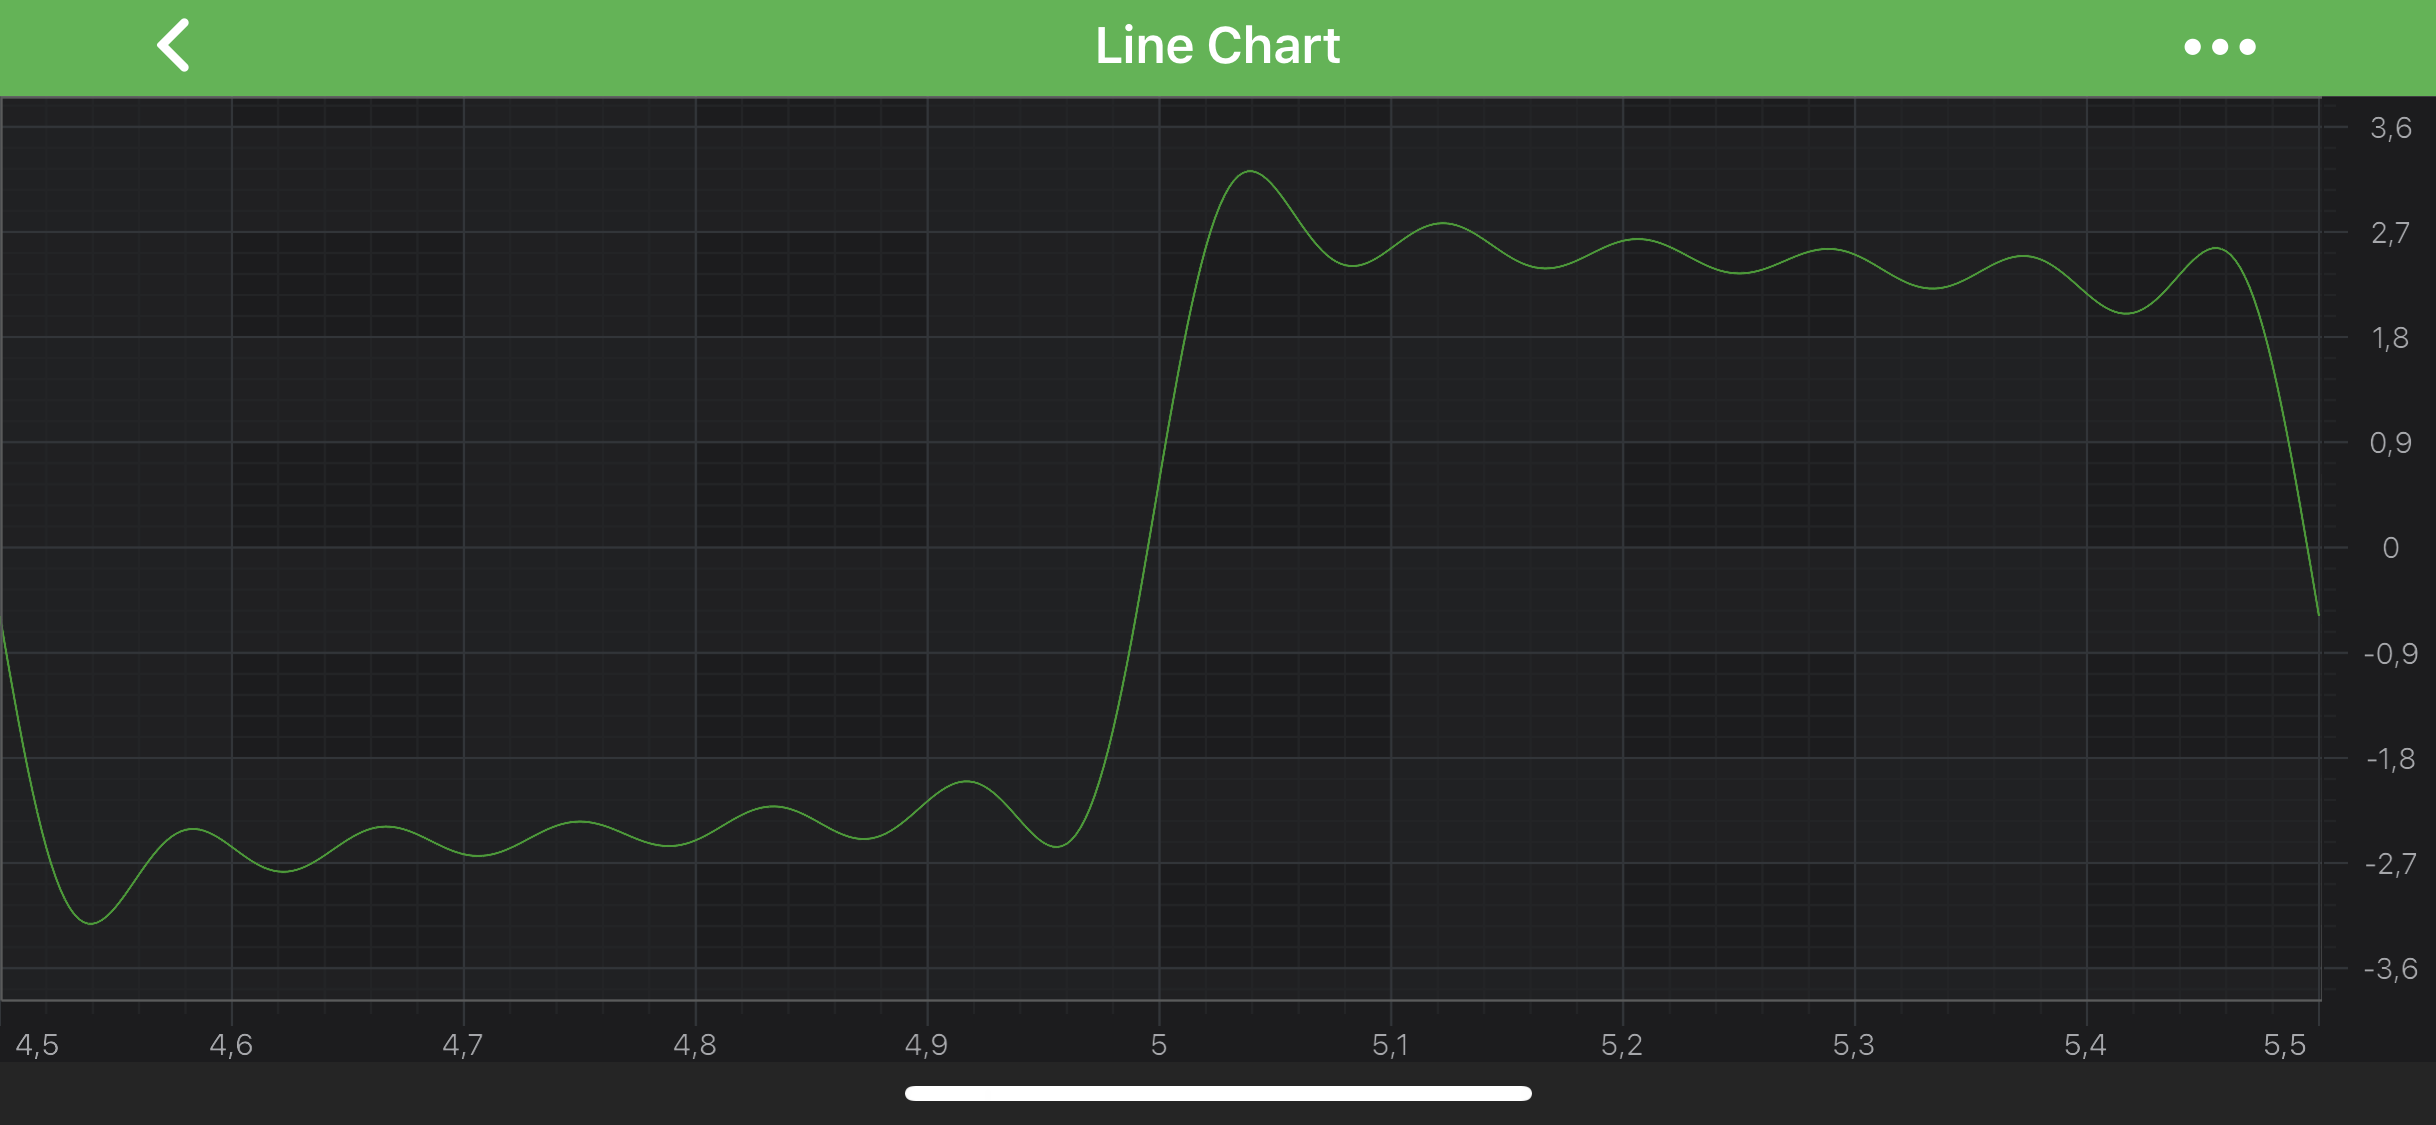
So let's set visibleRangeLimit = [4.5, 5.5]
final NumericAxis axis = new NumericAxis(getContext());
axis.setVisibleRangeLimit(new DoubleRange(4.5, 5.5));
After setting such VisibleRangeLimit and using ZoomExtents we now get an XAxis.visibleRange = [4.5, 5.5]. In other words, zooming has clipped or limited the visibleRange to [4.5, 5.5]
Note
VisibleRangeLimit expects a minimum and maximum value according to the setVisibleRange(IRange visibleRange) type.
VisibleRangeLimit Modes
Sometimes it is required to have one end of VisibleRange fixed or restrict VisibleRange either by min or max value. For that purposes, Axis API exposes RangeClipMode. It allows to specify visibleRangeLimitMode property to choose a behavior which is best suitable for a particular scenario.
- MinMax – (Default) allows clipping at Min and Max.
- Max - allows clipping only at Max.
- Min - allows clipping only at Min.
Use this property if you wish to ensure that one side of the chart is always clipped, while the other side is not. For instance:
final NumericAxis axis = new NumericAxis(getContext());
axis.setVisibleRangeLimit(new DoubleRange(0.0, 0.0));
axis.setVisibleRangeLimitMode(RangeClipMode.Min);
Results in a chart that always sets axis.visibleRange.min = 0 when you zoom to extents.
Note
VisibleRangeLimit does not clip data range when VisibleRangeLimit is greater than data range. In this case after ZoomExtents you’ll get the actual data range.
Advanced VisibleRange Clipping
visibleRangeLimit is a useful API to ensure the axis clips the visibleRange when zooming to extents. However, it will not stop a user from scrolling outside of that range. To achieve that, you will need to clip the visibleRange in code.
To clip the setVisibleRange(IRange visibleRange) and force a certain maximum or minimum, just use the following code:
final NumericAxis axis = new NumericAxis(getContext());
axis.setVisibleRangeChangeListener(new VisibleRangeChangeListener() {
    @Override
    public void onVisibleRangeChanged(IAxisCore axis, IRange oldRange, IRange newRange, boolean isAnimating) {
        // Set the old range back on the axis if the new Min is less than 0
        if (newRange.getMinAsDouble() < 0.0) {
            axis.setVisibleRange(oldRange);
        }
    }
});
Minimum or Maximum Zoom Level
If you want to constrain zoom depth in your application, the minimalZoomConstrain allows you to specify the minimal difference between Min and Max values of axis VisibleRange. If the difference becomes less than MinimalZoomConstrain value - then VisibleRange will not change.
It is also possible to specify the maximumZoomConstrain which defines the maximal difference between Min and Max values of axis VisibleRange. If the difference becomes more than MaximumZoomConstrain value - then VisibleRange will not change.
Read on to learn how to apply Minimum or Maximum Zoom Level for different Axis Types.
Specifying ZoomConstrains for NumericAxis
In the following code we are going to specify the visibleRange for NumericAxis. It should never become less than 10 and greater than 100. In other words - always be in range of [10, 100].
final NumericAxis axis = new NumericAxis(getContext());
axis.setMinimalZoomConstrain(10);
axis.setMaximumZoomConstrain(100);
Specifying ZoomConstrains for CategoryDateAxis
ZoomConstrains works differently if set on CategoryDateAxis. It determines the min/max zoom level on an axis which is possible to show by the specifying the amount of data points.
final CategoryDateAxis axis = new CategoryDateAxis(getContext());
axis.setMinimalZoomConstrain(10);
axis.setMaximumZoomConstrain(100);
In the code above, VisibleRange should show no less than 10 data points as well as no more that 100 data points.
Specifying ZoomConstrains for DateAxis
DateAxis has its specifics as well. It's VisibleRange is of DateRange type, so the Zoom Constraints is designed to specify the difference between two dates in seconds. Setting Zoom Constraints on a DateRange, you ensure that your axis.visibleRange.diff will never become less than the minimalZoomConstrain value and more than maximumZoomConstrain.
Note
For convenience, SciChart provides a bunch of helper methods in the DateIntervalUtil class:
DateAxis axis = new DateAxis(getActivity());
long min = DateIntervalUtil.fromMonths(2);
long max = DateIntervalUtil.fromMonths(10);
axis.setMinimalZoomConstrain(min);
axis.setMaximumZoomConstrain(max);
In the code above, the VisibleRange will satisfy the following equation: 2 months < VisibleRange < 10 month