
In SciChart WPF, Tooltips, rollover lines and markers are rendered on a canvas known as the SciChartSurface.ModifierSurface which is over the chart. This provides for fast, easy tooltips without any lag, and allows you to customize them easily, however it has a drawback:
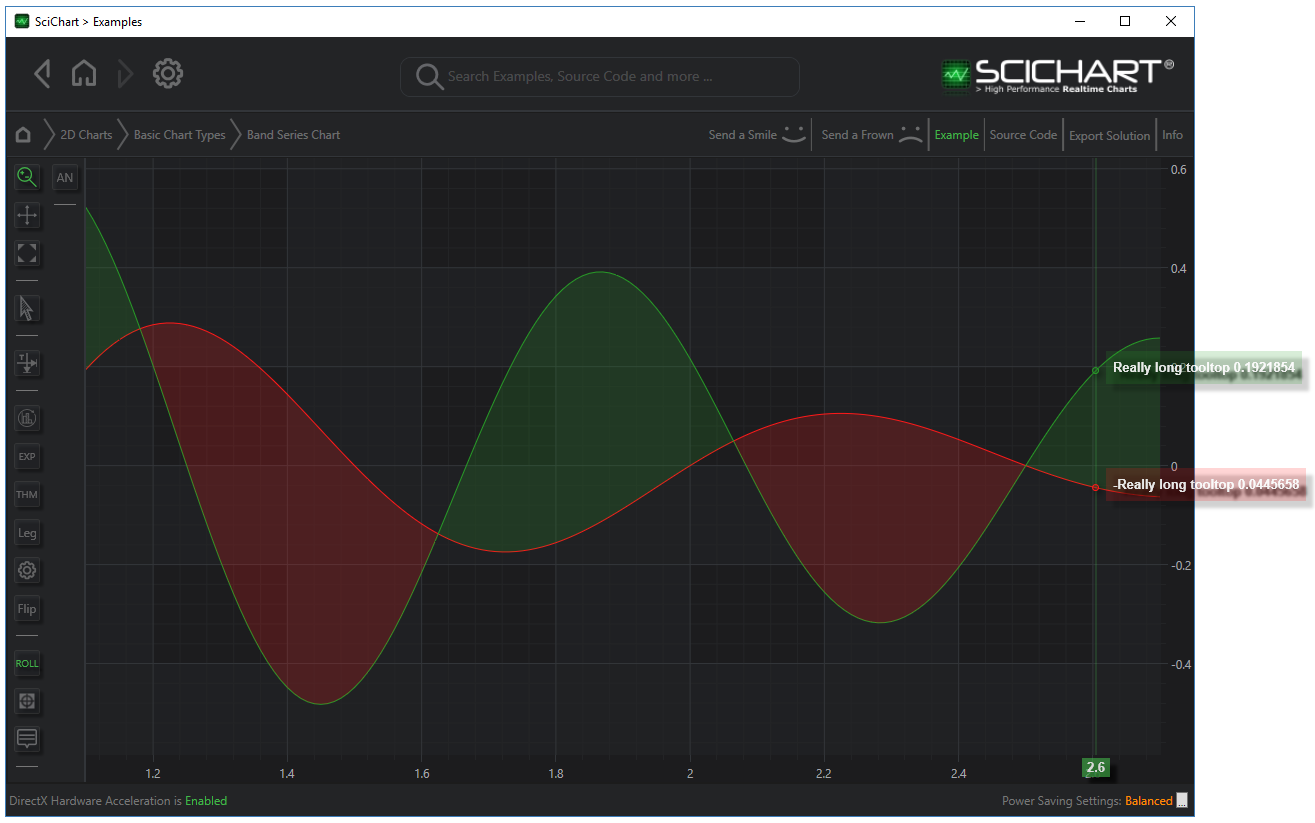
If you have many charts, or very small charts on the screen, sometimes the tooltip can be clipped at the edge of the chart.
To workaround this, SciChart tries to intelligently place the tooltip so that it is always visible on the screen, however sometimes this is not possible due to available space.
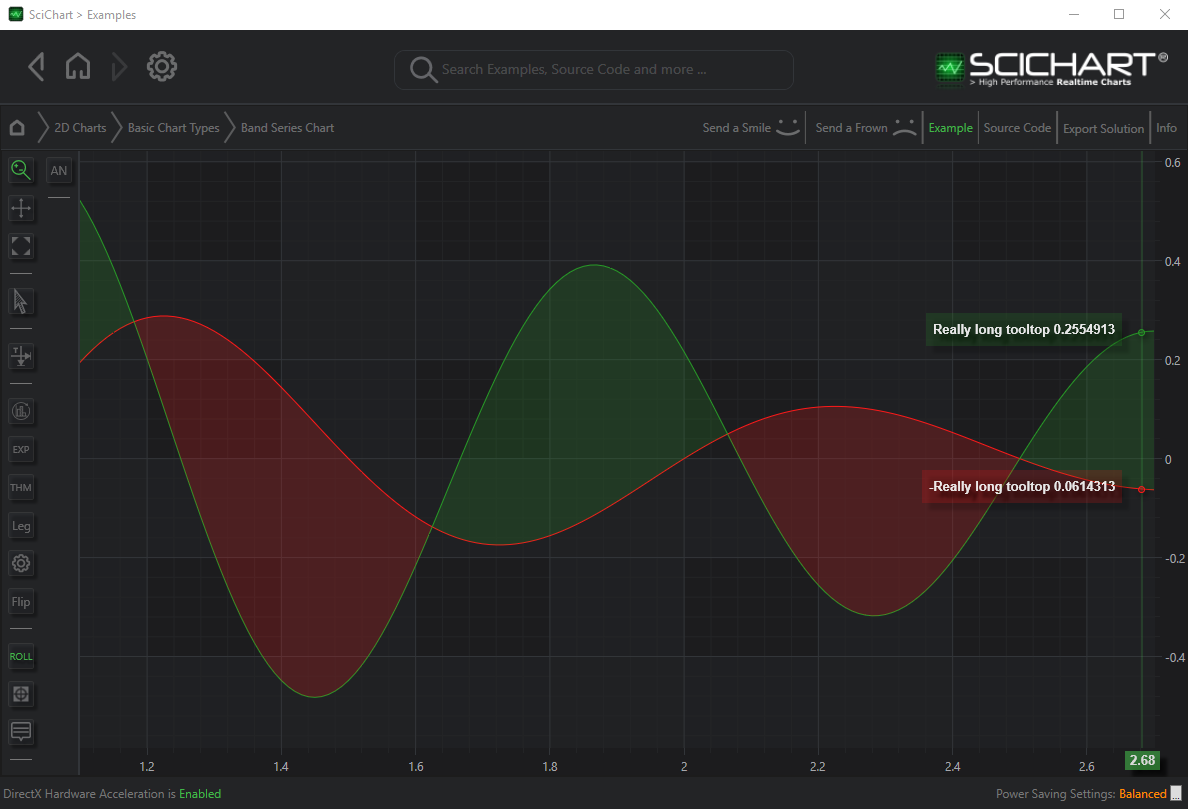
In the image above: Tooltips use the default ModifierSurface canvas to display Tooltip Controls. When the tooltip is near the right of the chart it will flip to be inside the chart. However, if the chart is small, there may not be available space to show the tooltip and it may clip.
The solution is to set the TooltipUsageMode Property on the RolloverModifier, CursorModifier, TooltipModifier or VerticalSliceModifier.
e.g.
| TooltipUsageMode example |
Copy Code |
|---|---|
// Draw the tooltip in a popup (Can go outside of the chart) RolloverModifier.TooltipUsageMode = TooltipUsageMode.Popup; // Draw the tooltip on the main canvas (default behaviour) RolloverModifier.TooltipUsageMode = TooltipUsageMode.TooltipControl; // Also applies to CursorModifier, VerticalSliceModifier, TooltipModifier // All other templating and customization of the tooltip is the same | |