
The 100% Stacked Mountains Type
100% Stacked Mountains are provided by the StackedMountainRenderableSeries type, when StackedMountainRenderableSeries.IsOneHundredPercent = true. This shares many of the properties with the FastMountainRenderableSeries type, with the added feature that mountains automatically stack (aggregate Y-values).
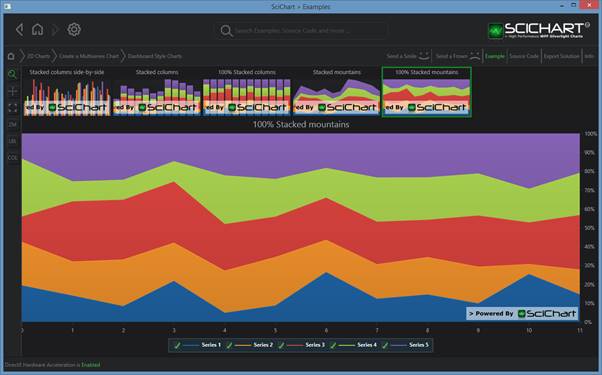
Examples for the 100% Stacked Mountain Chart can be found in the SciChart WPF Examples Suite which can be downloaded from the SciChart Website or our SciChart.WPF.Examples Github Repository.
To declare a 100% StackedMountainRenderableSeries, use the following code:
Declare a 100% StackedMountainRenderableSeries in Xaml / Code Behind
| Declare a 100% StackedMountainRenderableSeries |
Copy Code |
|---|---|
<Grid> <Grid.Resources> <LinearGradientBrush x:Key="chartFill1" StartPoint="0,0" EndPoint="0,1"> <GradientStop Offset="0" Color="#DDDBE0E1" /> <GradientStop Offset="1.0" Color="#88B6C1C3" /> </LinearGradientBrush> <LinearGradientBrush x:Key="chartFill0" StartPoint="0,0" EndPoint="0,1"> <GradientStop Offset="0" Color="#DDACBCCA" /> <GradientStop Offset="1.0" Color="#88439AAF" /> </LinearGradientBrush> </UserControl.Resources> <!-- Create the chart surface --> <s:SciChartSurface Name="sciChart"> <!-- Declare RenderableSeries --> <s:SciChartSurface.RenderableSeries> <s:StackedMountainRenderableSeries x:Name="mountainSeries1" Fill="{StaticResource chartFill0}" Stroke="#EEE" StrokeThickness="2" IsOneHundredPercent="True"/> <s:StackedMountainRenderableSeries x:Name="mountainSeries2" Fill="{StaticResource chartFill1}" Stroke="#EEE" StrokeThickness="2" IsOneHundredPercent="True"/> </s:SciChartSurface.RenderableSeries> <!-- Create an X Axis --> <s:SciChartSurface.XAxis> <s:NumericAxis/> </s:SciChartSurface.XAxis> <!-- Create a Y Axis with GrowBy --> <s:SciChartSurface.YAxis> <s:NumericAxis/> </s:SciChartSurface.YAxis> </s:SciChartSurface> </Grid> | |
| Declare a 100% StackedMountainRenderableSeries |
Copy Code |
|---|---|
// Code Behind, e.g. in OnLoaded event handler, set the DataSeries var yValues1 = new[] { 4.0, 7, 5.2, 9.4, 3.8, 5.1, 7.5, 12.4 }; var yValues2 = new[] { 15.0, 10.1, 10.2, 10.4, 10.8, 1.1, 11.5, 3.4 }; var dataSeries1 = new XyDataSeries<double, double>() { SeriesName = "data1" }; var dataSeries2 = new XyDataSeries<double, double>() { SeriesName = "data2" }; ; for (int i = 0; i < yValues1.Length; i++) dataSeries1.Append(i, yValues1[i]); for (int i = 0; i < yValues2.Length; i++) dataSeries2.Append(i, yValues2[i]); using (this.sciChart.SuspendUpdates()) { this.mountainSeries1.DataSeries = dataSeries1; this.mountainSeries2.DataSeries = dataSeries2; } | |
Declare a 100% StackedMountainRenderableSeries in Pure Code
| Declare a 100% StackedMountainRenderableSeries |
Copy Code |
|---|---|
var sciChartSurface = new SciChartSurface(); // Assumes X,y Axis have been declared var mountainSeries1 = new StackedMountainRenderableSeries() { StrokeThickness = 2, AntiAliasing = true, Stroke = Color.FromArgb(0xFF, 0xAA, 0xAA, 0xAA), Fill = new SolidColorBrush(Colors.LightSteelBlue), ZeroLineY = 0.0, IsOneHundredPercent = true, }; var mountainSeries2 = new StackedMountainRenderableSeries() { StrokeThickness = 2, AntiAliasing = true, Stroke = Color.FromArgb(0xFF, 0xAA, 0xAA, 0xAA), Fill = new SolidColorBrush(Colors.LightSteelBlue), ZeroLineY = 0.0, IsOneHundredPercent = true, }; sciChartSurface.RenderableSeries.Add(mountainSeries1); sciChartSurface.RenderableSeries.Add(mountainSeries2); var yValues1 = new[] { 4.0, 7, 5.2, 9.4, 3.8, 5.1, 7.5, 12.4, 14.6, 8.1, 11.7, 14.4, 16.0, 3.7, 5.1, 6.4, 3.5, 2.5, 12.4, 16.4, 7.1, 8.0, 9.0 }; var yValues2 = new[] { 15.0, 10.1, 10.2, 10.4, 10.8, 1.1, 11.5, 3.4, 4.6, 0.1, 1.7, 14.4, 6.0, 13.7, 10.1, 8.4, 8.5, 12.5, 1.4, 0.4, 10.1, 5.0, 0.0 }; var dataSeries1 = new XyDataSeries<double, double>() { SeriesName = "data1" }; var dataSeries2 = new XyDataSeries<double, double>() { SeriesName = "data2" }; ; for (int i = 0; i < yValues1.Length; i++) dataSeries1.Append(i, yValues1[i]); for (int i = 0; i < yValues2.Length; i++) dataSeries2.Append(i, yValues2[i]); using (this.sciChart.SuspendUpdates()) { mountainSeries1.DataSeries = dataSeries1; mountainSeries2.DataSeries = dataSeries2; } | |
NOTE: You can also declare RenderableSeries using full MVVM (series ViewModels). Please see MVVM DataSeries / RenderableSeries API for more details.
How the Stacking and Grouping Works
Please see the section under Stacked Mountain series > “How the Stacking and Grouping Works” for a detailed explanation.
See Also