SciChart WPF 3D Charts > 3D Chart Types > The SurfaceMesh 3D Chart Type > The Non-Uniform SurfaceMesh 3D Type
The Non-Uniform SurfaceMesh 3D Type

Examples for the Non-Uniform 3D Surface Mesh Chart can be found in the SciChart WPF Examples Suite which can be downloaded from the SciChart Website or our SciChart.WPF.Examples Github Repository.

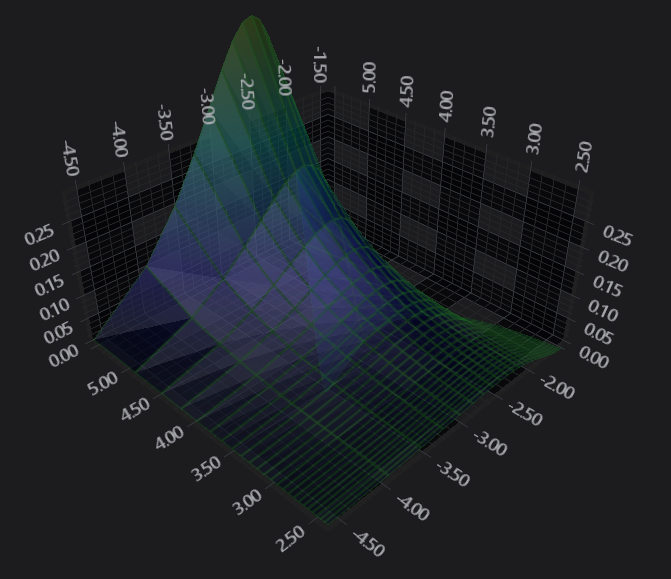
The surface mesh can also draw data with non-uniform spacing in Z and X with a slight variation in the code. We use a NonUniformGridDataSeries3D and pass X,Z Steppings to the constructor to space out the cells in the X and Z planes.


<s3D:SciChart3DSurface x:Name="sciChart" WorldDimensions="200,100,200" BorderThickness="0">
    <s3D:SciChart3DSurface.Camera>
        <s3D:Camera3D ZoomToFitOnAttach="True"/>
    </s3D:SciChart3DSurface.Camera>
    <s3D:SciChart3DSurface.RenderableSeries>
        <s3D:SurfaceMeshRenderableSeries3D x:Name="surfaceMeshRenderableSeries"
                                        DrawMeshAs="SolidWireFrame"
                                        Stroke="#77228B22"
                                        ContourStroke="#77228B22"
                                        StrokeThickness="2.0"
                                        DrawSkirt="False"
                                        Opacity="0.9">
           <s3D:SurfaceMeshRenderableSeries.MeshColorPalette>
              <s3D:GradientColorPalette>
                  <s3D:GradientColorPalette.GradientStops>
                     <GradientStop Offset="1" Color="DarkRed"/>
                     <GradientStop Offset="0.9" Color="Red"/>
                     <GradientStop Offset="0.7" Color="Yellow"/>
                     <GradientStop Offset="0.5" Color="GreenYellow"/>
                     <GradientStop Offset="0.3" Color="Cyan"/>
                     <GradientStop Offset="0.1" Color="Blue"/>
                     <GradientStop Offset="0.0" Color="#1D2C6B"/>
                  </s3D:GradientColorPalette.GradientStops>
              </s3D:GradientColorPalette>
           </s3D:SurfaceMeshRenderableSereis.MeshColorPalette>
        </s3D:SurfaceMeshRenderableSeries3D>
    </s3D:SciChart3DSurface.RenderableSeries>
    <s3D:SciChart3DSurface.XAxis>
        <s3D:NumericAxis3D />
    </s3D:SciChart3DSurface.XAxis>
    <s3D:SciChart3DSurface.YAxis>
        <s3D:NumericAxis3D VisibleRange="0,0.3"/>
    </s3D:SciChart3DSurface.YAxis>
    <s3D:SciChart3DSurface.ZAxis>
        <s3D:NumericAxis3D />
    </s3D:SciChart3DSurface.ZAxis>
</s3D:SciChart3DSurface>
int xSize = 25;
int zSize = 25;
var xSteppings = new double[25];
var ySteppings = new double[25];
// Create the stepping information for the X,Z cells
// The X-Z plane exists on the floor of the 3D Chart.
for (int i = 0; i < 25; i++)
{
    xSteppings[i] = Math.Log((i + 1) * 0.01);
    ySteppings[i] = 1 - xSteppings[i];
}
// Create the Nonuniform data series to hold the data
var meshDataSeries = new NonUniformGridDataSeries3D<double>(xSize, zSize, xIndex => xSteppings[xIndex], yIndex => ySteppings[yIndex])
{               
    SeriesName = "Nonuniform Surface Mesh",
};
// Now we populate our heights (The Y-values are up)
for (int x = 0; x < xSize; x++)
{
    for (int z = 0; z < zSize; z++)
    {
        double xVal = (double)x / (double)xSize * 25.0;
        double zVal = (double)z / (double)zSize * 25.0;
        double y = Math.Sin(xVal * 0.2) / ((zVal + 1) * 2);
        meshDataSeries[z, x] = y;
    }
}
// Assign the DataSeries to the chart
surfaceMeshRenderableSeries.DataSeries = meshDataSeries;


Data is stored in the NonUniformGridDataSeries3D Type. This represents a 2-dimensional array of arrays (or 2D Jagged array) typically of type Double (but can be defined with generics).


Some important points to note:

  • The double values stored in the NonUniformGridDataSeries3D correspond to the heights on the chart (the Y-Axis). They are transformed into chart World Coordinates via the SciChart3DSurface.YAxis.
  • The Z and X Data-Value is defined by the XStepping and ZStepping functions passed to the NonUniformGridDataSeries3D constructor. These are also transformed into World Coordinates via the SciChart3DSurface.ZAxis and XAxis respectively.
  • The Colours on the SurfaceMesh are defined by the MeshColorPalette. More on this in the following sections.


See Also