
Worked Example - Add a Series in MVVM
Worked Example: Add a Series in MVVM
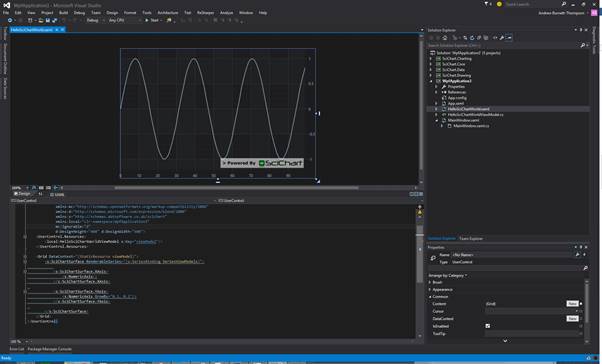
Adding a single series to a chart is as simple as binding to a collection of IRenderableSeriesViewModel and adding one LineRenderableSeriesViewModel. The LineRenderableSeriesViewModel itself contains properties to control the FastLineRenderableSeries (which is generated by SciChart) as well as the DataSeries. You can manipulate the data via DataSeries.Append, Update, Insert, Remove, or change the proeprties such as LineRenderableSeriesViewModel.StrokeThickness, AntiAliasing, StrokeDashArray to change how the line series draws.
View (XAML)
| Add a Series in MVVM |
Copy Code |
|---|---|
<UserControl x:Class="WpfApplication3.HelloSciChartWorld" xmlns="http://schemas.microsoft.com/winfx/2006/xaml/presentation" xmlns:x="http://schemas.microsoft.com/winfx/2006/xaml" xmlns:mc="http://schemas.openxmlformats.org/markup-compatibility/2006" xmlns:d="http://schemas.microsoft.com/expression/blend/2008" xmlns:s="http://schemas.abtsoftware.co.uk/scichart" xmlns:local="clr-namespace:WpfApplication3" mc:Ignorable="d" d:DesignHeight="400" d:DesignWidth="600"> <UserControl.Resources> <local:HelloSciChartWorldViewModel x:Key="viewModel"/> </UserControl.Resources> <Grid DataContext="{StaticResource viewModel}"> <s:SciChartSurface RenderableSeries="{s:SeriesBinding SeriesViewModels}"> <s:SciChartSurface.XAxis> <s:NumericAxis/> </s:SciChartSurface.XAxis> <s:SciChartSurface.YAxis> <s:NumericAxis GrowBy="0.1, 0.1"/> </s:SciChartSurface.YAxis> </s:SciChartSurface> </Grid> </UserControl> | |
ViewModel
| Add a Series in MVVM |
Copy Code |
|---|---|
public class HelloSciChartWorldViewModel : INotifyPropertyChanged { private readonly ObservableCollection<IRenderableSeriesViewModel> _seriesViewModels = new ObservableCollection<IRenderableSeriesViewModel>(); public event PropertyChangedEventHandler PropertyChanged; public HelloSciChartWorldViewModel() { var xyData = new XyDataSeries<double, double>(); for (int i = 0; i < 100; i++) { xyData.Append(i, Math.Sin(i * 0.2)); } SeriesViewModels.Add(new LineRenderableSeriesViewModel() { StrokeThickness = 1, AntiAliasing = true, DataSeries = xyData, }); } public ObservableCollection<IRenderableSeriesViewModel> SeriesViewModels { get { return _seriesViewModels; } } protected virtual void OnPropertyChanged(string propertyName) { var handler = PropertyChanged; if (handler != null) { handler(this, new PropertyChangedEventArgs(propertyName)); } } } | |