
Examples for the 3D Surface Mesh Chart can be found in the SciChart WPF Examples Suite which can be downloaded from the SciChart Website or our SciChart.WPF.Examples Github Repository.
The SurfaceMeshRenderableSeries3D accepts color palettes via the MeshColorPalette property. Several options are available for paletting the mesh, including:
- SolidColorBrushPalette - applies a solid color to all cells in the mesh
- GradientColorPalette - maps a LinearGradientBrush to the mesh, where heights map to successive colors.
- BrushColorPalette - maps a WPF Brush to the mesh. For example, this can be used to map an Image via the WPF ImageBrush type.
We will talk about each of these options below:
SolidColorBrushPalette
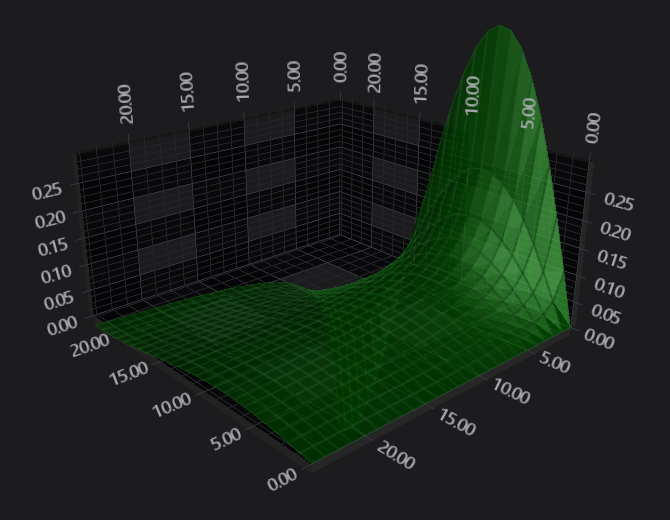
The SolidColorBrushPalette is simple enough. Simply declare one and set SolidColorBrushPalette.Fill to a Color.
| SolidColorBrushPalette |
Copy Code |
|---|---|
surfaceMeshRenderableSeries.MeshColorPalette = new SolidColorBrushPalette()
{
    Fill = Colors.DarkGreen,
}; | |
GradientColorPalette
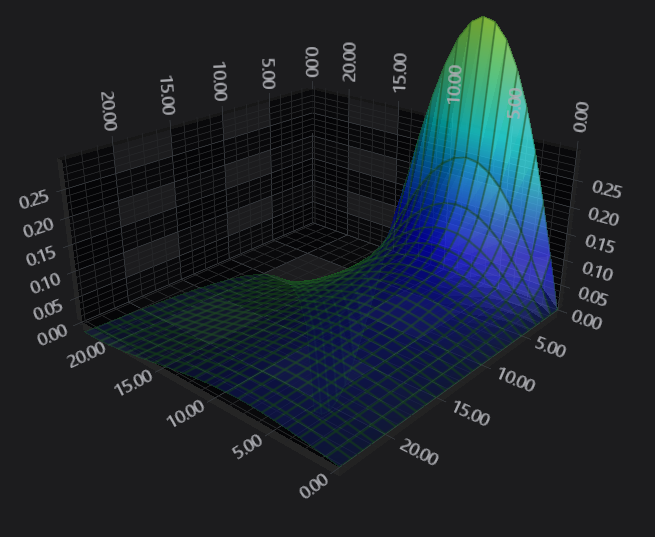
The GradientColorPalette can be used to map a Gradient Brush set of colors to heights in the Surface Mesh. The mapping is similar to that performed by the Heatmap Series in 2D Charts.
Given the following code:
| GradientColorPalette |
Copy Code |
|---|---|
<s3D:SciChart3DSurface x:Name="sciChart" WorldDimensions="200,100,200"> <s3D:SciChart3DSurface.RenderableSeries> <s3D:SurfaceMeshRenderableSeries3D x:Name="surfaceMeshRenderableSeries" DrawMeshAs="SolidWireFrame" Stroke="#77228B22" ContourStroke="#77228B22" StrokeThickness="2.0" DrawSkirt="False" Minimum="0" Maximum="1" Opacity="0.9"> <s3D:SurfaceMeshRenderableSeries.MeshColorPalette> <s3D:GradientColorPalette IsStepped="False"> <s3D:GradientColorPalette.GradientStops> <GradientStop Offset="1" Color="DarkRed"/> <GradientStop Offset="0.9" Color="Red"/> <GradientStop Offset="0.7" Color="Yellow"/> <GradientStop Offset="0.5" Color="GreenYellow"/> <GradientStop Offset="0.3" Color="Cyan"/> <GradientStop Offset="0.1" Color="Blue"/> <GradientStop Offset="0.0" Color="#1D2C6B"/> </s3D:GradientColorPalette.GradientStops> </s3D:GradientColorPalette> </s3D:SurfaceMeshRenderableSereis.MeshColorPalette> </s3D:SurfaceMeshRenderableSeries3D> </s3D:SciChart3DSurface.RenderableSeries> <!-- Axis omitted for brevity --> </s3D:SciChart3DSurface> | |
Colors are mapped onto Y-values as follows:
- Y values corresponding to SurfaceMeshRenderableSeries3D.Minimum are drawn with the GradientStop Color at offset 0.
- Y values corresponding to SurfaceMeshRenderableSeries3D.Maximum are drawn with the GradientStop Color at offset 1.
- All other values are linearly interpolated (including Y-values outside of SurfaceMeshRenderableSeries3D.Minimum and SurfaceMeshRenderableSeries3D.Maximum).
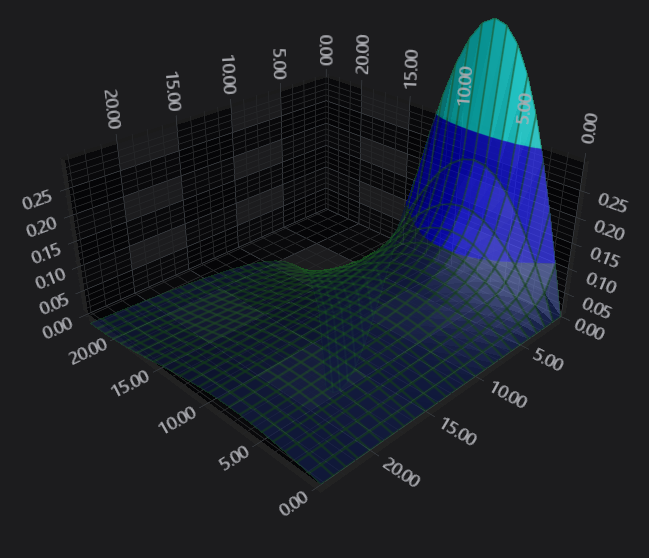
GradientColorPalette.IsStepped
When the property GradientColorPalette.IsStepped is set to true, the color map is not interpolated, and graidnet stops are interpretted as hard steppings. The Surface Mesh now looks like this:
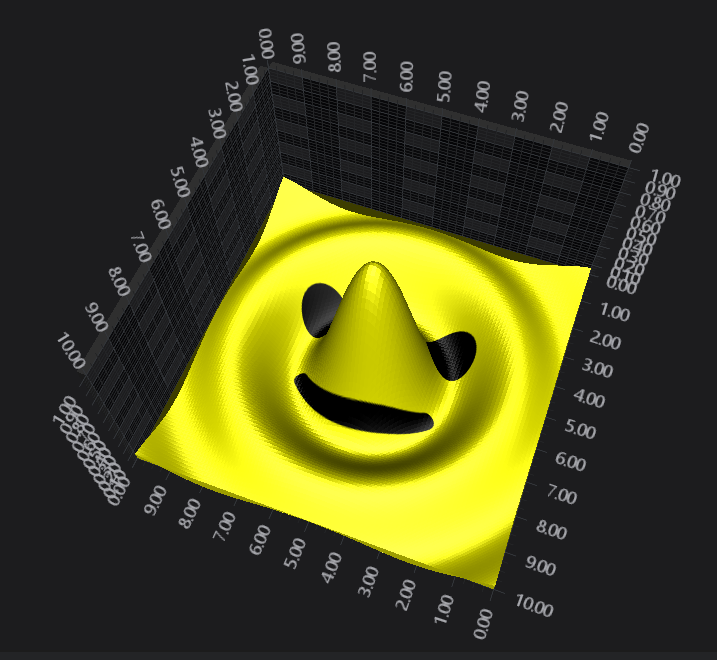
BrushColorPalette
A texture can be applied to the SurfaceMesh and mapped over it in the X-Z plane by using a combination of BrushColorPalette and MeshPaletteMode.Textured.
| Example Title |
Copy Code |
|---|---|
<s3D:SciChart3DSurface x:Name="sciChart" WorldDimensions="200,100,200"> <s3D:SciChart3DSurface.RenderableSeries> <s3D:SurfaceMeshRenderableSeries3D x:Name="surfaceMeshRenderableSeries" DrawMeshAs="SolidMesh" MeshPaletteMode="Textured" Opacity="0.9"> <s3D:SurfaceMeshRenderableSeries.MeshColorPalette> <s3D:BrushColorPalette> <s3D:BrushColorPalette.Brush> <ImageBrush Source="Smiley.jpg"/> </s3D:BrushColorPalette.Brush> </s3D:BrushColorPalette> </s3D:SurfaceMeshRenderableSereis.MeshColorPalette> </s3D:SurfaceMeshRenderableSeries3D> </s3D:SciChart3DSurface.RenderableSeries> <!-- Axis omitted for brevity --> </s3D:SciChart3DSurface> | |
Creating a Custom Palette
You can create a custom Color Palette by inheriting MeshColorPalette and overriding GetTexture. For example, see below.
| CustomColorPalette |
Copy Code |
|---|---|
public class CustomColorPalette : MeshColorPalette { /// <summary> /// Gets the <see cref="Texture2D" /> to apply to the <see cref="SurfaceMeshRenderableSeries3D" />, given the size passed in. /// </summary> /// <param name="size">The size.</param> /// <returns> /// The <see cref="Texture2D" /> instance to map to the surface /// </returns> public override Texture2D GetTexture(Size size) { if (brush == null) return null; var writableBitmap = BitmapFactory.New((int) size.Width, (int) size.Height); // TODO: Fill your WriteableaBitmap return Texture2D.FromWriteableBitmap(writableBitmap); // Alternatively. You can create brushes from WPF elements like this // var coloredRect = new Rectangle { Width = size.Width, Height = size.Height, Fill = new RadialGradientBrush ... }; // // return Texture2D.FromWriteableBitmap(coloredRect.RenderToBitmap()); // // OR like this // // return Texture2D.FromArgb(uint[] argb, int width, int height); } public void RefreshPalette() { // Call this base class method to refresh the palette and trigger a redraw this.OnColorPaletteChanged(); } } | |
The palette is applied to a SurfaceMeshRenderableSeries as before.
Effect of SurfaceMeshRenderableSeries3D.MeshPaletteMode
The MeshPaletteMode property changes how the palette is applied to the Mesh.
- MeshPaletteMode.Textured means the Palette is applied to the mesh in the X-Z plane (the plane of the floor of the 3D Chart). Imagine the palette is stretched over the mesh itself.
- MeshPaletteMode.HeightMapInterpolated means the palette is applied in the Y direction (vertically).
- Other variations such as MeshPaletteMode.TexturedSolidCells and HeightMapSolidCells perform the above two functions but without linear interpolation between nearby cells. use this to have each cell a constant colour.