SciChart supports shading of chart regions via the Axis Bands API. Shaded regions are referred to as "Axis Bands"
Default Shading
Default Axis Bands can be enabled via the DrawMajorBands property on Axis. In this case space between Major Gridlines will be filled with default shadowing color in alternate pattern. Frequency of Major Gridlines depends on Axis Ticks Frequency and can be changed accordingly.
The shadowing color can be changed via the AxisBandsFill property:
| AxisBandsFill property |
Copy Code |
|---|---|
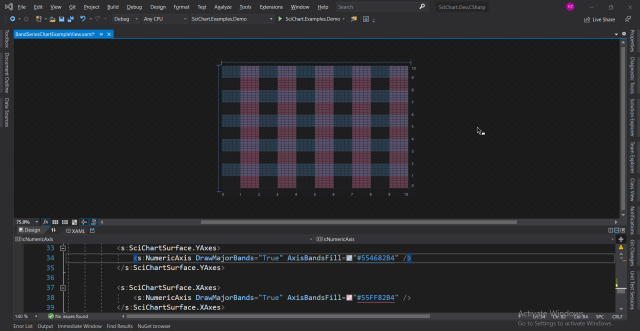
<s:SciChartSurface> <s:SciChartSurface.YAxes> <s:NumericAxis DrawMajorBands="True" AxisBandsFill="#554682B4" /> </s:SciChartSurface.YAxes> <s:SciChartSurface.XAxes> <s:NumericAxis DrawMajorBands="True" AxisBandsFill="#55FF82B4" /> </s:SciChartSurface.XAxes> </s:SciChartSurface> | |
This markup will result in a chart similar to the one below:
Custom Shading
Shading of particular chart regions is possible using AxisBandsProvider API. It allows to create a type responsible for rendering Axis Bands at specific locations.
AxisBandsProviders must implement the IAxisBandsProvider interface can be applied to an Axis via the AxisBandsProvider property. There are existing implementations of IAxisBandsProvider in SciChart corresponding to Axis types:
Custom shadowing regions can be defined as instances of a type implementing the IAxisBandInfo interface. The default implementation is represented by AxisBandInfo<T> type. Instances of it should be added to the AxisBands collection of AxisBandsProvider:
| AxisBands collection of AxisBandsProvider |
Copy Code |
|---|---|
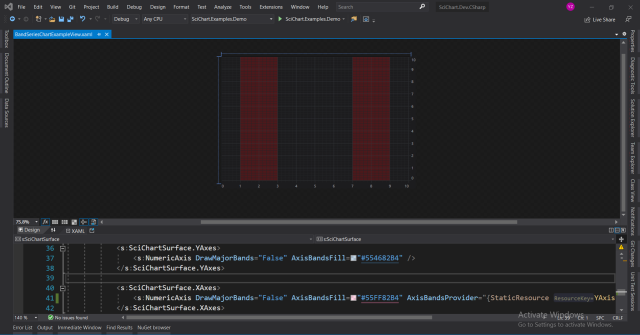
var axisBandsProvider = new NumericAxisBandsProvider(); var fillColor = Color.FromArgb(55, 255, 12, 18); axisBandsProvider.AxisBands.Add(new AxisBandInfo<DoubleRange>(new DoubleRange(1, 3), fillColor)); axisBandsProvider.AxisBands.Add(new AxisBandInfo<DoubleRange>(new DoubleRange(6, 9), fillColor)); XAxis.AxisBandsProvider = axisBandsProvider; | |
When applied to an XAxis it will result in a chart similar to this one: