
SciChart 3D shares the same AxisCore as SciChart 2D. Many of the following features are shared. For your convenience, some of the documentation has been duplicated here, with some referring to other sections of the user manual.
Axis 3D TextFormatting
All Axis obey standard .NET Formatting strings via the AxisCore.TextFormatting property.
e.g. several examples can be found at the following articles:
- Axis TextFormatting and CursorTextFormatting
- Axis LabelProvider API (Dynamic or complex text formatting)
Axis 3D AutoRanging & Setting VisibleRange
AxisBase3D derived Types also have AutoRanging behaviour as per the 2D axis types. The AxisCore.AutoRange property defines how the axis will autorange when data is changed.
The AxisCore.VisibleRange property allows you to set or get the VisibleRange on the axis.
For more info see:
NOTE: In a 3D Axis, AutoRanging means ‘given a fixed size of Axis in 3D world coordinates, change the VisibleRange Max/Min to fit the data’. Dynamically positioning the camera to view all of the 3D Chart is known as ‘Zoom to Fit’ and is performed by Camera3D.ZoomToFit().
Axis 3D Tick Frequency
In SciChart, the ticks are small marks around the chart on an axis. They Also define the spacing of Gridlines, Axis Labels and Axis Bands.
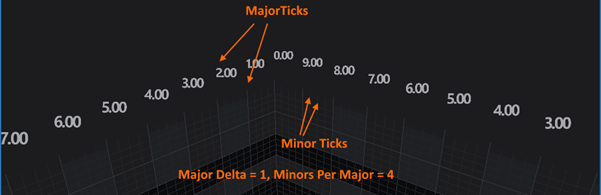
AxisBase3D tick intervals can be changed using the same APIs as SciChart 2D. For further information see: