
The ChartModifierBase API is by far the most powerful API in the SciChart library.
Using this API you can create behaviours which you can attach to a chart to perform custom Zooming, Panning, Annotation & Markers, Legend output and much much more. Any time you want to do something in C# code to alter the behaviour of a SciChartSurface you should be thinking about creating a custom modifier to do it.
The ChartModifierBase type
The ChartModifierBase provides an abstract base class for all of the ChartModifiers within SciChart. All of our built-in modifiers such as ZoomPanModifier, RolloverModifier, TooltipModifier, YAxisDragModifier inherit ChartModifierBase.
You can create your own ChartModifiers by inheriting this class. For example, you can declare a modifier like this:
| The ChartModifierBase type |
Copy Code |
|---|---|
public class DoubleClickToZoomExtentsModifier : ChartModifierBase { public override void OnModifierDoubleClick(ModifierMouseArgs e) { base.OnModifierDoubleClick(e); base.ParentSurface.AnimateZoomExtents(TimeSpan.FromMilliseconds(500)); } } | |
And apply it like this:
| The ChartModifierBase type |
Copy Code |
|---|---|
<s:SciChartSurface> <s:SciChartSurface.ChartModifier> <local:DoubleClickToZoomExtentsModifier/> </s:SciChartSurface.ChartModifier> </s:SciChartSurface> | |
... and you've just created your first custom Zoom Extents behaviour using the ChartModifier API!
The Most Important Methods / Properties in the ChartModifierBase class
ChartModifierBase Properties
The API Documentation will tell you everything that ChartModifierBase can do, but for your convenience we've listed the most important methods and properties below:
| Property | Description |
| IsEnabled | Gets or sets a value indicating whether this ChartModifier is enabled |
| IsMouseLeftButtonDown | Gets if the Left mouse button is currently down |
| IsMouseMiddleButtonDown | Gets if the Middle mouse button is currently down |
| IsMouseRightButtonDown | Gets of the right mouse button is currently down |
| ModifierSurface | Gets the IChartModifierSurface instance on the parent SciChartSurface, which acts as a canvas to place UIElements |
| ParentSurface | Overridden. Gets or sets the parent SciChartSurface, to perform operations on |
| ReceiveHandledEvents | Gets or sets a value, indicates whether current modifier handles events which have already been marked as handled |
| XAxis / XAxes | Returns the XAxes on the parent Abt.Controls.SciChart.Visuals.SciChartSurface |
| YAxis / YAxes | Returns the YAxes on the parent Abt.Controls.SciChart.Visuals.SciChartSurface |
ChartModifierBase Methods
| Methods | Description |
| GetPointRelativeTo |
Transforms the input point relative to the IHitTestable element. Can be used to transform points relative to the SciChartSurface.ModifierSurface, or SciChartSurface.XAxis for instance. |
| IsPointWithinBounds |
Gets whether the mouse point is within the bounds of the hit-testable element. Assumes the mouse-point has not been translated yet (performs translation) |
| OnAttached | Called when the element is attached to the Chart Surface |
| OnDetached | Called immediately before the element is detached from the Chart Surface |
| OnMasterMouseLeave | Called when the mouse leaves the Master of current MouseEventGroup |
| OnModifierDoubleClick | Called when a Mouse DoubleClick occurs on the parent SciChartSurface, |
| OnModifierMouseDown | Called when a Mouse Button is pressed on the parent SciChartSurface, |
| OnModifierMouseMove | Called when the Mouse is moved on the parent SciChartSurface, |
| OnModifierMouseUp | Called when a Mouse Button is released on the parent SciChartSurface, |
| OnModifierMouseWheel | Called when the Mouse Wheel is scrolled on the parent SciChartSurface, |
| OnModifierTouchDown | Called when a Multi-Touch Down interaction occurs on the parent SciChartSurface, |
| OnModifierTouchMove | Called when a Multi-Touch Move interaction occurs on the parent SciChartSurface, |
| OnModifierTouchUp | Called when a Multi-Touch Up interaction occurs on the parent SciChartSurface, |
| OnParentSurfaceRendered | Called when the parentSciChartSurface,is rendered |
| OnParentSurfaceResized | Called when the parent SciChartSurface, is resized |
| OnParentSurfaceMouseEnter | Called when the mouse enters the parent SciChartSurface, |
| OnParentSurfaceMouseLeave | Called when the mouse leaves the parent SciChartSurface, |
| OnSelectedSeriesChanged | Called when the parent surface SelectedSeries collection changes |
| OnXAxesCollectionChanged |
Overridden. Called with the SciChartSurface.XAxes AxisCollection changes. Overridden in derived classes to get notification of this event |
| OnYAxesCollectionChanged |
Overridden. Called with the SciChartSurface.YAxes AxisCollection changes. Overridden in derived classes to get notification of this event |
So you can see there are a lot of powerful API functions on the ChartModifierBase class!
Using this one base-class you can:
- Be notified about Mouse Clicks, Mouse Down, Mouse Move, or when the mouse enters or leaves the chart
- Be notified when the SciChartSurface is rendered or resized, or when the XAxis or YAxis collection changed
- Access the ParentSurface and therefore access the XAxis, YAxis, RenderableSeries, DataSeries and Annotations on the chart
- Access the ModifierSurface - a dedicated Canvas over the chart for drawing UIElements such as Tooltips, Lines, Zoom Rectangles - anything really!
All of our Chart Modifiers are built with this API, the possibilities are really endless!
Overriding Mouse Events
To get a notification of mouse-event on the parent SciChartSurface, simply override OnModifierMouseDown, OnModifierMouseMove, OnModifierMouseUp:
| Overriding Mouse Events |
Copy Code |
|---|---|
public class TestChartModifier : ChartModifierBase { /// <summary> /// Called when a Mouse Button is pressed on the parent <see cref="SciChartSurface" /> /// </summary> /// <param name="e">Arguments detailing the mouse button operation</param> public override void OnModifierMouseDown(ModifierMouseArgs e) { base.OnModifierMouseDown(e); } /// <summary> /// Called when the Mouse is moved on the parent <see cref="SciChartSurface" /> /// </summary> /// <param name="e">Arguments detailing the mouse move operation</param> public override void OnModifierMouseMove(ModifierMouseArgs e) { base.OnModifierMouseMove(e); } /// <summary> /// Called when a Mouse Button is released on the parent <see cref="SciChartSurface" /> /// </summary> /// <param name="e">Arguments detailing the mouse button operation</param> public override void OnModifierMouseUp(ModifierMouseArgs e) { base.OnModifierMouseUp(e); } /// <summary> /// Called when the Mouse Wheel is scrolled on the parent <see cref="SciChartSurface" /> /// </summary> /// <param name="e">Arguments detailing the mouse wheel operation</param> public override void OnModifierMouseWheel(ModifierMouseArgs e) { base.OnModifierMouseWheel(e); } /// <summary> /// Called when a Mouse DoubleClick occurs on the parent <see cref="SciChartSurface" /> /// </summary> /// <param name="e">Arguments detailing the mouse button operation</param> public override void OnModifierDoubleClick(ModifierMouseArgs e) { base.OnModifierDoubleClick(e); } } | |
When your chart modifier is attached to a SciChartSurface, mouse events on the chart will propagate to the TestChartModifier instance:
| Overriding Mouse Events |
Copy Code |
|---|---|
<s:SciChartSurface>
   <s:SciChartSurface.ChartModifier>
      <s:TestChartModifier/>
   </s:SciChartSurface.ChartModifier>
</s:SciChartSurface> | |
ModifierMouseArgs Properties
The ModifierMouseArgs passed in to mouse-callbacks can tell you:
- The X-Y coordinate of the mouse when the event took place
- The Mouse-buttons currently pressed.
- Whether the mouse-event occurred on this SciChartSurface (isMaster=true) or not (isMaster=false)
- The modifier key (e.g. CTRL, SHIFT) currently pressed
| ModifierMouseArgs Properties |
Copy Code |
|---|---|
public class TestChartModifier : ChartModifierBase { /// <summary> /// Called when a Mouse Button is pressed on the parent <see cref="SciChartSurface" /> /// </summary> /// <param name="e">Arguments detailing the mouse button operation</param> public override void OnModifierMouseDown(ModifierMouseArgs e) { base.OnModifierMouseDown(e); Point mousePoint = e.MousePoint; MouseButtons mouseButtons = e.MouseButtons; bool isMaster = e.IsMaster; MouseModifier modifierKey = e.Modifier; } } | |
Transforming Coordinates to the Viewport
Mouse coordinates are measured according to the top-left of the SciChartSurface. To effectively use these mouse-coordinates, they may need to be translated to the central viewport.
| Transforming Coordinates to the Viewport |
Copy Code |
|---|---|
public class TestChartModifier : ChartModifierBase { /// <summary> /// Called when a Mouse Button is pressed on the parent <see cref="SciChartSurface" /> /// </summary> /// <param name="e">Arguments detailing the mouse button operation</param> public override void OnModifierMouseDown(ModifierMouseArgs e) { base.OnModifierMouseDown(e); Point xy = e.MousePoint; var scs = base.ParentSurface; // gets the bounds of the ModifierSurface with respect to the RootGrid // which hosts the SciChartSurface var modifierRect = ModifierSurface.GetBoundsRelativeTo(RootGrid); // Translates the mouse point (from root grid coords) to ModifierSurface coords var x1y1 = base.GetPointRelativeTo(xy, base.ModifierSurface); // you can now use this coordinate to convert to data values double dataValue = scs.XAxis.GetCurrentCoordinateCalculator() .GetDataValue(x1y1.X); } } | |
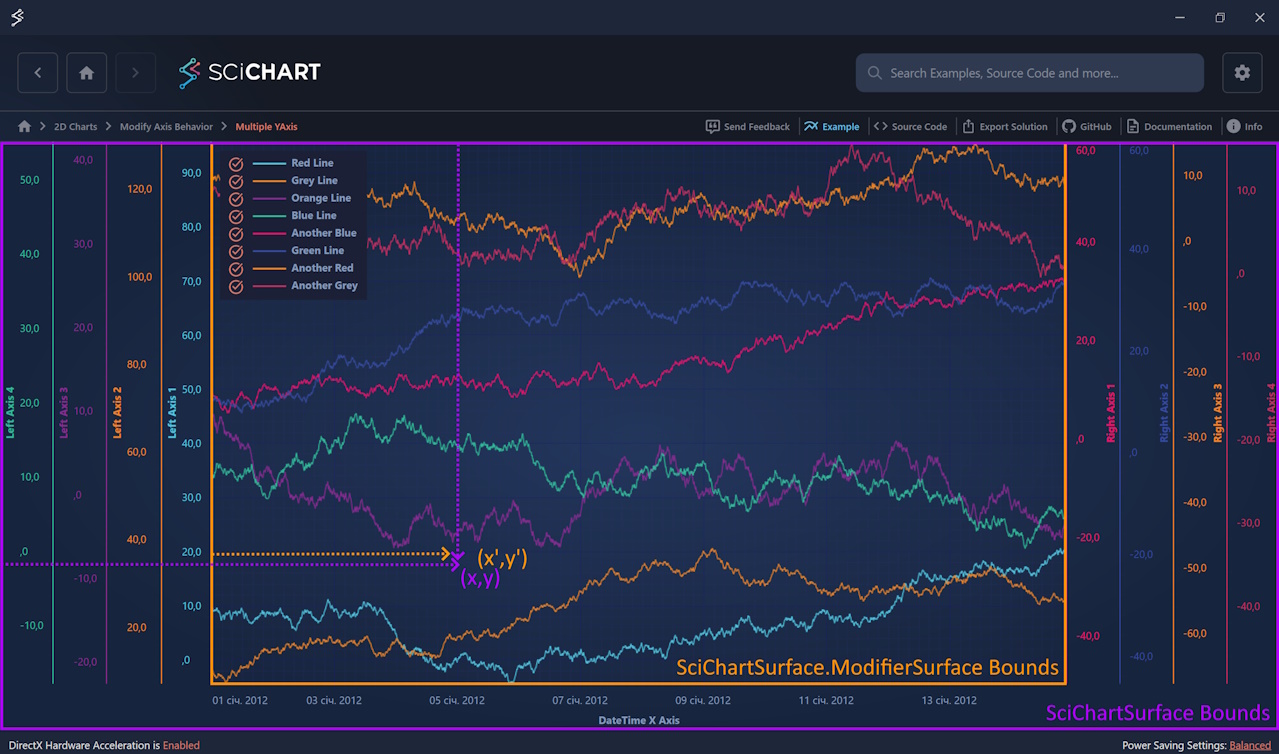
Given a SciChartSurface bounds and a mouse coordinate (x,y), you may need to transform to viewport coordinates (x’,y’)
Determining if Mouse Event occurred over an Axis or main chart surface
To determine if a mouse-point is over an element, we can use code similar to the following. This is useful if you want to start a modifier action only if the mouse-down occurred on an axis, or on the main chart.
| Determining if Mouse Event occurred over an Axis or main chart surface |
Copy Code |
|---|---|
public class HitTestingModifier : ChartModifierBase { public override void OnModifierMouseDown(ModifierMouseArgs e) { bool isOnChart = IsPointWithinBounds(e.MousePoint, ModifierSurface); bool isOnYAxis = IsPointWithinBounds(e.MousePoint, YAxis); bool isOnXAxis = IsPointWithinBounds(e.MousePoint, XAxis); MessageBox.Show(string.Format("Clicked YAxis? {0}\nClicked XAxis? {1}\n" + “Clicked Chart? {2}", isOnYAxis, isOnXAxis, isOnChart)); base.OnModifierMouseDown(e); } public bool IsPointWithinBounds(Point point, IHitTestable element) { var x1y1 = ParentSurface.RootGrid.TranslatePoint(point, element); var fe = (element as FrameworkElement); bool inBounds = (x1y1.X <= fe.ActualWidth && x1y1.X >= 0) && (x1y1.Y <= fe.ActualHeight && x1y1.Y >= 0); return inBounds; } } | |
Determining if the Mouse is over a RenderableSeries
To determine if a mouse-event occurred over a RenderableSeries, you can combine the ChartModifier API with the Hit-Test API, described in RenderableSeries Hit-Test API
| Determining if the Mouse is over a RenderableSeries |
Copy Code |
|---|---|
public class TestChartModifier : ChartModifierBase { /// <summary> /// Called when a Mouse Button is pressed on the parent <see cref="SciChartSurface" /> /// </summary> /// <param name="e">Arguments detailing the mouse button operation</param> public override void OnModifierMouseDown(ModifierMouseArgs e) { base.OnModifierMouseDown(e); double hitTestRadius = 5d; bool interpolate = true; foreach (var rSeries in base.ParentSurface.RenderableSeries) { var hitResult = rSeries.HitTest(e.MousePoint, hitTestRadius, interpolate); if (hitResult.IsHit) { // Mouse is over series! } } } } | |
Determining Drag on the chart
Determining Drag on the chart is as simple as registering MouseDown, followed by MouseMove and MouseUp on the chart. To do this, we suggest using some Boolean flags to track the state of the current mouse. All the modifier callbacks are called on the UI thread so you can be assured of the thread safety of the API.
Overriding Touch Events
SciChart’s ChartModifierBase API also has a number of callbacks for processing touch events. These us the TouchPoint class in WPF4’s multi-touch API.
| Overriding Touch Events |
Copy Code |
|---|---|
public class TestChartModifier : ChartModifierBase { /// <summary> /// Called when a Multi-Touch Down occurs on the parent <see cref="SciChartSurface" /> /// </summary> /// <param name="e">Arguments detailing the manipulation operation</param> public override void OnModifierTouchDown(ModifierTouchManipulationArgs e) { base.OnModifierTouchDown(e); IEnumerable<TouchPoint> touchPoints = e.Manipulators; } /// <summary> /// Called when a Multi-Touch Move occurs on the parent <see cref="SciChartSurface" /> /// </summary> /// <param name="e">Arguments detailing the manipulation operation</param> public override void OnModifierTouchMove(ModifierTouchManipulationArgs e) { base.OnModifierTouchMove(e); } /// <summary> /// Called when a Multi-Touch Up occurs on the parent <see cref="SciChartSurface" /> /// </summary> /// <param name="e">Arguments detailing the manipulation operation</param> public override void OnModifierTouchUp(ModifierTouchManipulationArgs e) { base.OnModifierTouchUp(e); } } | |
Similar notes apply to e.IsMaster and also translating TouchPoint.Position to the main central viewport as in Transforming Coordinates to the Viewport section.
Overriding Key Events
SciChart also allows handling of Key events in the ChartModifier API. To get a notification of a key event, simply override OnModifierKeyDown, OnModifierKeyUp
| Overriding Key Events |
Copy Code |
|---|---|
public class TestChartModifier : ChartModifierBase { /// <summary> /// Called when the KeyDown event is fired for the Master of the current <see cref="MouseEventGroup" /> /// </summary> /// <param name="e">Arguments detailing the key event</param> public override void OnModifierKeyDown(ModifierKeyArgs e) { base.OnModifierKeyDown(e); Key key = e.Key; MouseModifier modifierKey = e.Modifier; bool isMaster = e.IsMaster; } /// <summary> /// Called when the KeyUp event is fired for the Master of the current <see cref="MouseEventGroup" /> /// </summary> /// <param name="e">Arguments detailing the key event</param> public override void OnModifierKeyUp(ModifierKeyArgs e) { base.OnModifierKeyUp(e); } } | |
Drawing Shapes over the Chart with the ModifierSurface
The ChartModifierBase API was primarily designed to facilitate behavior-like classes to give zoom and pan behaviours to the chart. This quickly evolved into tooltips and now any behavior which requires access to the underlying SciChartSurface visual or logical elements could be placed in a ChartModifier.
To draw shapes over the chart at the time of using a ChartModifier, you can use the SciChartSurface.ModifierSurface property.
The ModifierSurface is simply a canvas which is overlaid on top of the SciChartSurface. This is a great place to put tooltips or temporary UI such as zoom-box rectangles as you interact with the chart. The following code demonstrates how to add a Shape to the ModifierSurface on MouseDown for instance:
| Drawing Shapes over the Chart with the ModifierSurface |
Copy Code |
|---|---|
public class TestChartModifier : ChartModifierBase { /// <summary> /// Called when a Mouse Button is pressed on the parent <see cref="SciChartSurface" /> /// </summary> /// <param name="e">Arguments detailing the mouse button operation</param> public override void OnModifierMouseDown(ModifierMouseArgs e) { base.OnModifierMouseDown(e); Point xy = e.MousePoint; var rect = new Rectangle() { Fill = new SolidColorBrush(Color.FromArgb(0x33, 0xFF, 0xFF, 0xFF), Width = 10, Height = 10 }; base.ParentSurface.ModifierSurface.Children.Add(rect); Canvas.SetLeft(rect, 100); Canvas.SetTop(rect, 200); } } | |
Custom ChartModifier Tutorials
A number of custom chartmodifier examples and tutorials have been prepared at the Custom ChartModifiers Knowledgebase section