
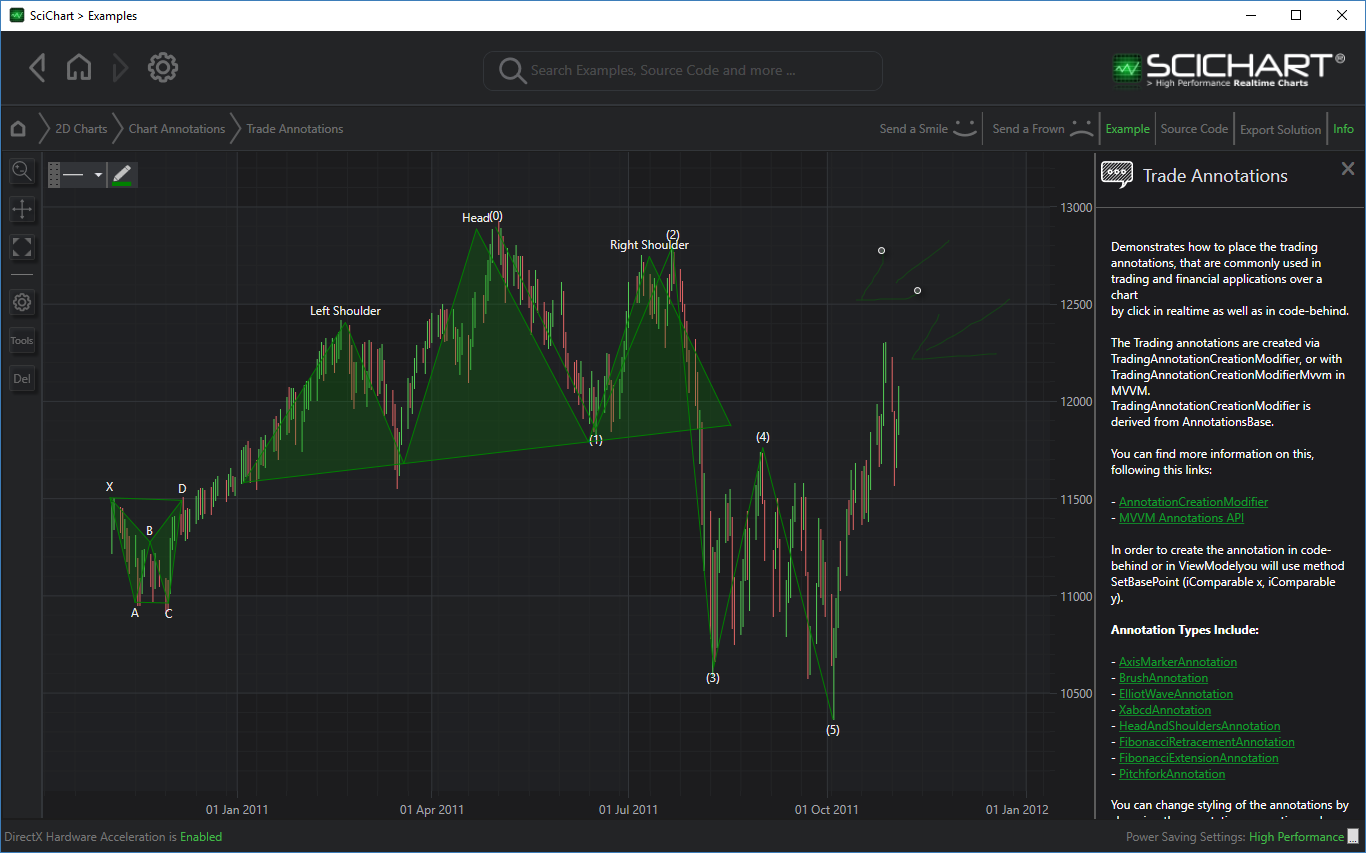
SciChart features a rich DrawingTools API, that allows you to place special tools over the chart. DrawingTools are special annotation types which are widely used by traders for analysis and are popular to try to predict financial prices from previous data.
Common Properties
Below we include some common properties found in TradingAnnotationBase.
Almost all of the DrawingTools in SciChart derive from TradingAnnotationBase. TradingAnnotation derives from CompositeAnnotation. This means that each of the DrawingTools have the same common properties as a Composite Annotation that is derived from Annotation Base.
|
TradingAnnotation properties |
Description |
|
Define the stroke thickness for lines that are used in many TradingAnnotations. | |
|
Define the stroke for lines that are used in many TradingAnnotations. | |
|
Defines the style for lines that are used in many TradingAnnotations. | |
| InitialBasePoints | Defines the ObservableCollection that is used for initializing drawing tools annotations in xaml. Actually this is collection of points that on initializing of annotation calls internally SetBasePoint() method for propper displaying of annotation. |
| BasePointsCount | Defines the limit of base points |
Comparable Point
Drawing Tools also provides a special class called ComparablePoint which stores X and Y values. This class is used in all of drawing tools so they can be initialized from XAML or code, and cope with the variable number of X,Y points that each drawing tool requires.
| ComparablePoint.cs |
Copy Code |
|---|---|
/// <summary> /// Represents an x- and y-DataValue pair in two-dimensional space. /// </summary> public class ComparablePoint { /// <summary> /// Gets or sets X DataValue /// </summary> public IComparable X { get; set; } /// <summary> /// Gets or sets Y DataValue /// </summary> public IComparable Y { get; set; } } | |