
SciChart features the ability to change color on a point-by-point basis, using the PaletteProvider feature.
Many series types support PaletteProvider, including:
- FastLineRenderableSeries
- XyScatterRenderableSeries
- FastCandlestickRenderableSeries
- FastMountainRenderableSeries
- FastColumnRenderableSeries
- FastOhlcRenderableSeries
- FastBubbleRenderableSeries
To enable the paletting feature, you need to create a class which inherits IStrokePaletteProvider or IFillPaletteProvider, or IPointMarkerPaletteProvider, and assign or bind to the BaseRenderableSeries.PaletteProvider property.
IStrokePaletteProvider interface
The IStrokePaletteProvider interface is defined as follows:
| IStrokePaletteProvider interface |
Copy Code |
|---|---|
/// <summary> /// Defines the interface to a PaletteProvider. By implementing this interface, you can /// override the stroke color on a <see cref="BaseRenderableSeries"/> /// by setting or binding to the <see cref="BaseRenderableSeries.PaletteProvider"/> /// property. /// </summary> public interface IStrokePaletteProvider : IPaletteProvider { /// <summary> /// Overrides the color of the outline on the attached <see cref="IRenderableSeries" />. /// Return null to keep the default series color. /// Return a value to override the series color. /// </summary> /// <param name="series">The source <see cref="IRenderableSeries" />.</param> /// <param name="index">The index of the point.</param> /// <param name="metadata">The metadata of the point.</param> Color? OverrideStrokeColor(IRenderableSeries series, int index, IPointMetadata metadata); } // Where ... // /// <summary> /// Defines the most common interface to a PaletteProvider. /// </summary> public interface IPaletteProvider { /// <summary> /// Called at the start of an renderable series rendering, before the /// current draw operation. /// </summary> /// <param name="series"></param> void OnBeginSeriesDraw(IRenderableSeries series); } | |
IFillPaletteProvider Interface
The IFillPaletteProvider interface is defined as follows:
| IFillPaletteProvider Interface |
Copy Code |
|---|---|
/// <summary> /// Defines the interface to a PaletteProvider. By implementing this interface, /// you can override the stroke color on a <see cref="BaseRenderableSeries"/> /// by setting or binding to the <see cref="BaseRenderableSeries.PaletteProvider"/> /// property. /// </summary> public interface IFillPaletteProvider : IPaletteProvider { /// <summary> /// Overrides the fill brush of the attached <see cref="BaseRenderableSeries" />. /// Return null to keep the default series fill. /// Return a value to override the series fill. /// </summary> /// <param name="series">The source <see cref="BaseRenderableSeries" />.</param> /// <param name="index">The index of the point.</param> /// <param name="metadata">The metadata of the point.</param> Brush OverrideFill(IRenderableSeries series, int index, IPointMetadata metadata); } | |
Where IPaletteProvider is defined above.
IPointMarkerPaletteProvider Interface
The IPointMarkerPaletteProvider interface is defined as follows:
| IPointMarkerPaletteProvider Interface |
Copy Code |
|---|---|
/// <summary> /// Defines the interface to a PaletteProvider. By implementing this interface, you can /// override the Fill and Stroke color of <see cref="BaseRenderableSeries.PointMarker"/> /// by setting or binding to the <see cref="BaseRenderableSeries.PaletteProvider"/> /// property. /// </summary> public interface IPointMarkerPaletteProvider : IPaletteProvider { /// <summary> /// Overrides the color of the PointMarkers on the attached /// <see cref="IRenderableSeries" />. /// Return <value>Null</value> to keep the default <see cref="IPointMarker.Stroke"/> /// and <see cref="IPointMarker.Fill"/>. /// Set either <see cref="PointPaletteInfo.Stroke"/> or /// <see cref="PointPaletteInfo.Fill"/> /// to override <see cref="IPointMarker.Stroke"/> or <see cref="IPointMarker.Fill"/> /// correspondingly. /// </summary> /// <param name="series">The source <see cref="IRenderableSeries" />.</param> /// <param name="index">The index of the point.</param> /// <param name="metadata">The metadata of the point.</param> PointPaletteInfo? OverridePointMarker(IRenderableSeries series, int index, IPointMetadata metadata); } | |
Where IPaletteProvider is defined above.
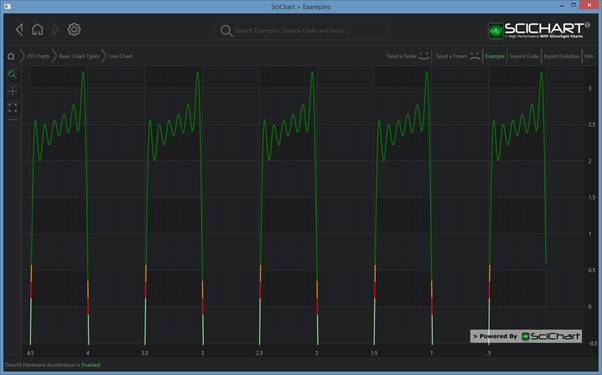
Worked Example: Attaching a PaletteProvider to a Line Series
A worked example of applying an IStrokePaletteProvider to a FastLineRenderableSeries can be found below:
| Attaching a PaletteProvider to a Line Series |
Copy Code |
|---|---|
// Custom PaletteProvider public class MyLinePaletteProvier : IStrokePaletteProvider { private XyDataSeries<double, double> _theSourceData; public void OnBeginSeriesDraw(IRenderableSeries series) { // OnBeginSeriesDraw is a good place to cache dataseries _theSourceData = (XyDataSeries<double, double>) series.DataSeries; } public Color? OverrideStrokeColor(IRenderableSeries series, int index, IPointMetadata metadata) { // Called for every data-point to draw // you can access data from series.DataSeries.XValues and YValues // the index is the index to the data // // the metadata is an optional object you can pass in to DataSeries if you want // remember to cast it! // If Y>0.5, draw green if (_theSourceData.YValues[index] > 0.5) { return Colors.Green; } // If Y>0.2, draw Orange else if (_theSourceData.YValues[index] > 0.2) { return Colors.Orange; } // If Y>0.0 draw Red else if (_theSourceData.YValues[index] > 0.0) { return Colors.Red; } // Else, use series default stroke else { return null; // default line stroke } } } | |
Usage:
| Attaching a PaletteProvider to a Line Series |
Copy Code |
|---|---|
<!-- Create the chart surface --> <s:SciChartSurface> <s:SciChartSurface.Resources> <local:MyLinePaletteProvider x:Key="MyLinePaletteProvider"/> </s:SciChartSurface.Resources> <!-- Declare RenderableSeries --> <s:SciChartSurface.RenderableSeries> <s:FastLineRenderableSeries x:Name="lineRenderSeries" Stroke="#FF99EE99" StrokeThickness="2" PaletteProvider="{StaticResource MyLinePaletteProvider}"/> </s:SciChartSurface.RenderableSeries> </s:SciChartSurface> | |
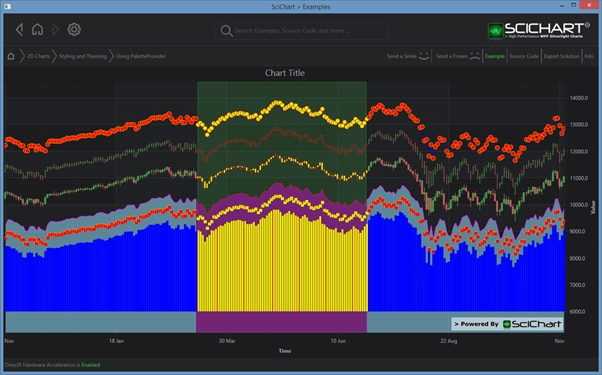
Worked Example: Attaching a PaletteProvider to a Mountain, Candlestick, Column or Ohlc Series
A worked example of applying an IFillPaletteProvider & IStrokePaletteProvider to a FastMountainRenderableSeries can be found below. The same interfaces (IFillPaletteProvider, IStrokePaletteProvider) can also be used on FastCandlestickRenderableSeries, FastColumnRenderableSeries.
|
Applying a PaletteProvider to a FastMountainRenderableSeries |
Applying a PaletteProvider to FastCandlestickRenderableSeries |
|
|
Applying a PaletteProvider to a FastOhlcRenderableSeries |
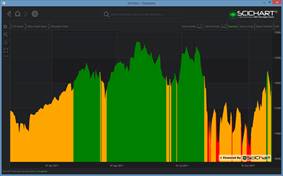

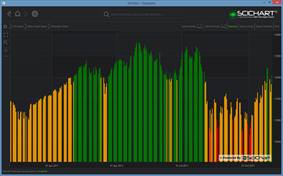

Stroke and Fill of the above renderable series can be styled individually. Returning null for either stroke, or fill, or both, causes the default series values to be used.
| Attaching a PaletteProvider to a Mountain, Candlestick, Column or Ohlc Series |
Copy Code |
|---|---|
// Custom PaletteProvider // For Mountain, Column and Candlestick series you must implement IStrokePaletteProvider // and IFillPaletteProvider public class MyFillPaletteProvider : IStrokePaletteProvider, IFillPaletteProvider { private XyDataSeries<DateTime, double> _theSourceData; public void OnBeginSeriesDraw(IRenderableSeries series) { // OnBeginSeriesDraw is a good place to cache dataseries _theSourceData = (XyDataSeries<DateTime, double>)series.DataSeries; } public Brush OverrideFill(IRenderableSeries series, int index, IPointMetadata metadata) { // Extra credit. Cache the brushes to avoid recreating them each time var color = OverrideStrokeColor(series, index, metadata); return color.HasValue ? new SolidColorBrush(color.Value) : null; } public Color? OverrideStrokeColor(IRenderableSeries series, int index, IPointMetadata metadata) { // Called for every data-point to draw // you can access data from series.DataSeries.XValues and YValues // the index is the index to the data // // the metadata is an optional object you can pass in to DataSeries if you want // remember to cast it! // If Y>0.5, draw green if (_theSourceData.YValues[index] > 12000) { return Colors.Green; } // If Y>0.2, draw Orange else if (_theSourceData.YValues[index] > 11000) { return Colors.Orange; } // If Y>0.0 draw Red else if (_theSourceData.YValues[index] > 10000) { return Colors.Red; } // Else, use series default stroke else { return null; // default line stroke } } } | |
Usage:
| Usage |
Copy Code |
|---|---|
<!-- Create the chart surface --> <s:SciChartSurface> <s:SciChartSurface.Resources> <local:MyFillPaletteProvider x:Key="pp"/> </s:SciChartSurface.Resources> <!-- Declare RenderableSeries --> <s:SciChartSurface.RenderableSeries> <s:FastMountainRenderableSeries x:Name="mountainRenderSeries" Stroke="#FF99EE99" Fill="#77FF6600" StrokeThickness="2" PaletteProvider="{StaticResource pp}"/> </s:SciChartSurface.RenderableSeries> </s:SciChartSurface> | |
Worked Example: Attaching a PaletteProvider to a Scatter-Line or Scatter Series
In order to color scatter points (BasePointMarker derived types) individually, you will need to implement IPointMarkerPaletteProvider.
Stroke and Fill of the PointMarkers can be styled individually. Returning null for either Stroke, or Fill, or the result causes the default PointMarker values to be used.
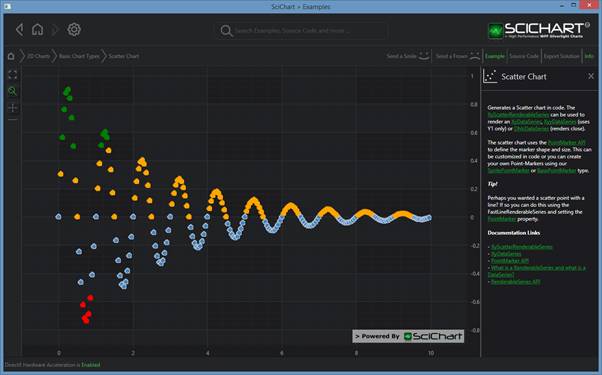
Applying an IPointMarkerPaletteProvider to any series with a PointMarker, e.g. XyScatterRenderableSeries
| Attaching a PaletteProvider to a Scatter-Line or Scatter Series |
Copy Code |
|---|---|
// Custom IPointMarkerPaletteProvider // For series with PointMarkers, you must implement IPointMarkerPaletteProvider public class MyPointMarkerPaletteProvider : IPointMarkerPaletteProvider { private XyDataSeries<double, double> _theSourceData; public void OnBeginSeriesDraw(IRenderableSeries series) { // OnBeginSeriesDraw is a good place to cache dataseries _theSourceData = (XyDataSeries<double, double>)series.DataSeries; } public PointPaletteInfo? OverridePointMarker(IRenderableSeries series, int index, IPointMetadata metadata) { // Called for every data-point to draw // you can access data from series.DataSeries.XValues and YValues // the index is the index to the data // // the metadata is an optional object you can pass in to DataSeries // remember to cast it! // If Y>0.5, draw green if (_theSourceData.YValues[index] > 0.5) { return new PointPaletteInfo() { Fill = Colors.Green, Stroke = Colors.Green, }; } // If Y>0.2, draw Orange else if (_theSourceData.YValues[index] > 0.0) { return new PointPaletteInfo() { Fill = Colors.Orange, Stroke = Colors.Orange, }; } // If Y>0.0 draw Red else if (_theSourceData.YValues[index] < -0.5) { return new PointPaletteInfo() { Fill = Colors.Red, Stroke = Colors.Red, }; } // Else, use series default stroke else { return null; // default line stroke } } } | |