
The Bubble 3D Chart Type
Examples for the Bubble 3D Chart can be found in the SciChart WPF Examples Suite which can be downloaded from the SciChart Website or our SciChart.WPF.Examples Github Repository.
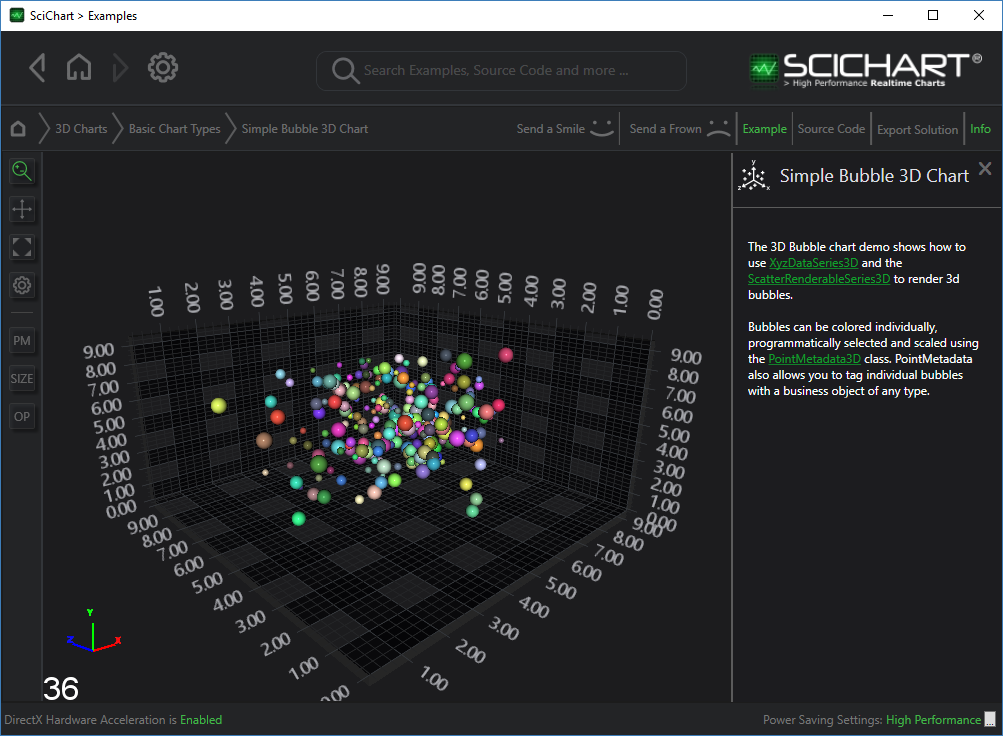
3D Bubble Charts are provided by the ScatterRenderableSeries3D type.
The ScatterRenderableSeries3D supports multiple pointmarkers, including:
3D Marker Types
- SpherePointMarker3D - a 3D Sphere at each point
- CubePointMarker3D - 3D Cube at each point
- PyramidPointMarker3D - a 3D Pyramid at each point
- CylinderPointMarker3D - a 3D Cylinder at each point
Fast 2D Marker types
- PixelPointMarker3D - a single pixel at each point
- QuadPointMarker3D - a Quad (flat square) facing the camera at each point
- EllipsePointMarker3D - a flat ellipse facing the camera at each point
- TrianglePointMarker3D - a flat triangle facing the camera at each point
- CustomPointMarker3D - custom flat textured markers facing the camera at each point
Declaring a 3D Scatter Series with custom Sizes & Colors
To declare a 3D Scatter Series with individual sizes & colors, use the following code.
| View |
Copy Code |
|---|---|
<s3D:SciChart3DSurface x:Name="SciChart" Grid.Column="1" BorderThickness="0" WorldDimensions="200,100,200"> <s3D:SciChart3DSurface.Camera> <s3D:Camera3D ZoomToFitOnAttach="True" /> </s3D:SciChart3DSurface.Camera> <s3D:SciChart3DSurface.RenderableSeries> <!-- To create a Scatter Chart, create a ScatterRenderableSeries3D and use a 3D point marker type --> <s3D:ScatterRenderableSeries3D x:Name="ScatterSeries3D"> <s3D:ScatterRenderableSeries3D.PointMarker> <s3D:SpherePointMarker /> </s3D:ScatterRenderableSeries3D.PointMarker> </s3D:ScatterRenderableSeries3D> </s3D:SciChart3DSurface.RenderableSeries> <s3D:SciChart3DSurface.XAxis> <s3D:NumericAxis3D GrowBy="0.1, 0.1" /> </s3D:SciChart3DSurface.XAxis> <s3D:SciChart3DSurface.YAxis> <s3D:NumericAxis3D GrowBy="0.1, 0.1" /> </s3D:SciChart3DSurface.YAxis> <s3D:SciChart3DSurface.ZAxis> <s3D:NumericAxis3D GrowBy="0.1, 0.1" /> </s3D:SciChart3DSurface.ZAxis> <s3D:SciChart3DSurface.ChartModifier> <s3D:XyzGizmoModifier3D /> </s3D:SciChart3DSurface.ChartModifier> </s3D:SciChart3DSurface> | |
| Code Behind |
Copy Code |
|---|---|
private void OnLoaded(object sender, RoutedEventArgs routedEventArgs) { var xyzDataSeries3D = new XyzDataSeries3D<double>() {SeriesName = "Colorful Bubble!"}; const int count = 250; var random = new Random(0); for (var i = 0; i < count; i++) { var x = DataManager.Instance.GetGaussianRandomNumber(5, 1.5); var y = DataManager.Instance.GetGaussianRandomNumber(5, 1.5); var z = DataManager.Instance.GetGaussianRandomNumber(5, 1.5); // Scale is a multiplier used to increase/decrease ScatterRenderableSeries3D.ScatterPointSize var scale = (float) ((random.NextDouble() + 0.5)*3.0); // Color is applied to PointMetadata3D and overrides the default ScatterRenderableSeries.Stroke property Color? randomColor = Color.FromArgb(0xFF, (byte) random.Next(50, 255), (byte) random.Next(50, 255), (byte) random.Next(50, 255)); // To declare scale and colour, add a VertextData class as the w (fourth) parameter. // The PointMetadata3D class also has other properties defining the behaviour of the XYZ point xyzDataSeries3D.Append(x, y, z, new PointMetadata3D(randomColor, scale)); } ScatterSeries3D.DataSeries = xyzDataSeries3D; PointMarkerCombo.SelectedIndex = 0; } | |
NOTE: You can also declare RenderableSeries using full MVVM (series ViewModels) using the SeriesBinding MarkupExtension. Please see MVVM DataSeries / RenderableSeries API for more details.