
3D Column Charts are provided by the ColumnRenderableSeries3D type.
Declaring a 3D Column Chart
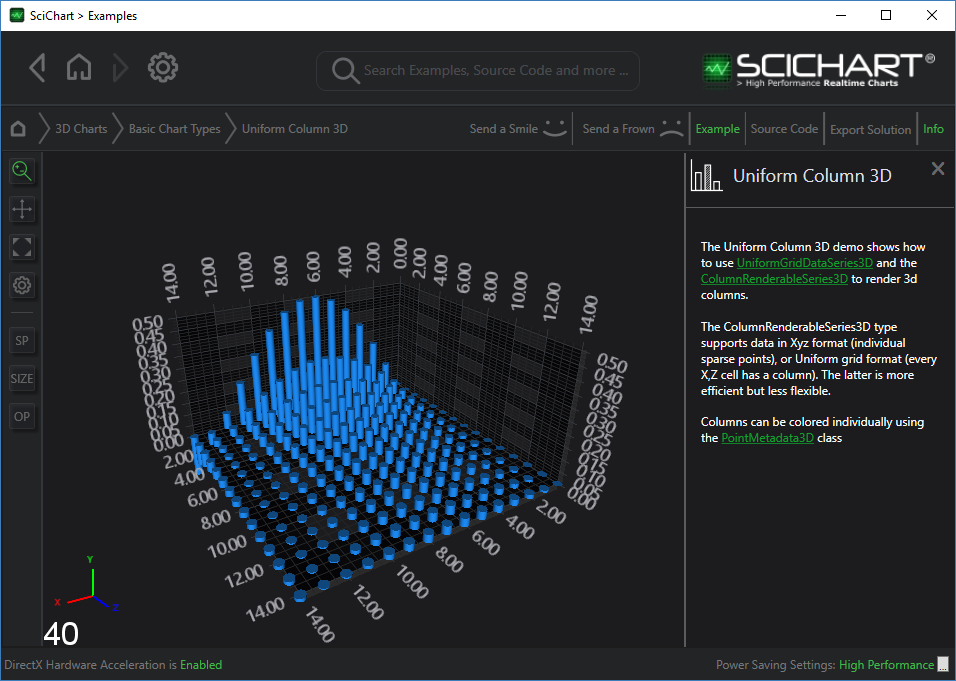
The ColumnRenderableSeries3D accepts either XyzDataSeries3D for sparse points, Or UniformGridDataSeries3D for an NxM array of points.
The above graph is rendered with the following code:
However it could be just as easily created with an XyzDataSeries3D as the DataSeries for sparse columns.
Single Row Column 3D Charts
By changing a few parameters, it is possible to get a column chart to look like this:
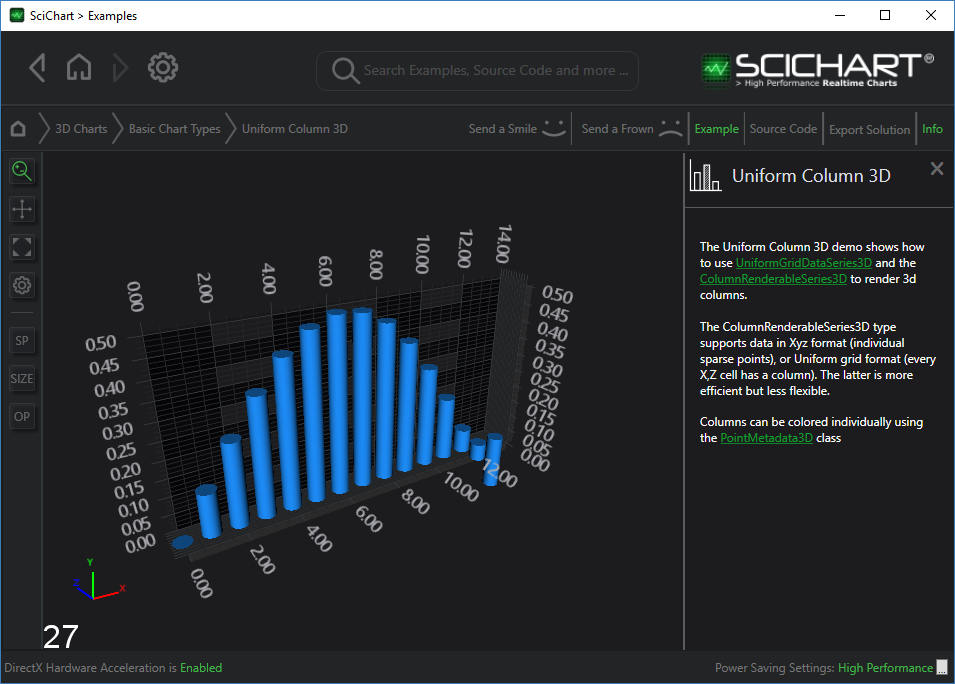
The code to achieve the above is as follows:
3D Column Shapes
The column shape can be defined by one of several pointmarkers, including:
- SpherePointMarker3D - a 3D Sphere at each point
- CubePointMarker3D - 3D Cube at each point
- PyramidPointMarker3D - a 3D Pyramid at each point
- CylinderPointMarker3D - a 3D Cylinder at each point
Apply the Type of point marker to the ColumnRenderableSeries3D.ColumnShape property to change the column shape.
Setting Column Sizes
Column sizes are set as a ratio of the available space between the neighbouring points.
Setting the properties ColumnRenderableSeries3D.DataPointWidth, DataPointWidthX, DataPointWidthZ changes the ratio of space allocated to the column in the X & Z direction.
ZeroLineY for 3D Columns
This feature allows specifying Zero position for 3D Column series relatively to YAxis. By default, all 3D Columns begin at XZ plane position. Now it is possible to set Y-Value at which 3D Columns will start:
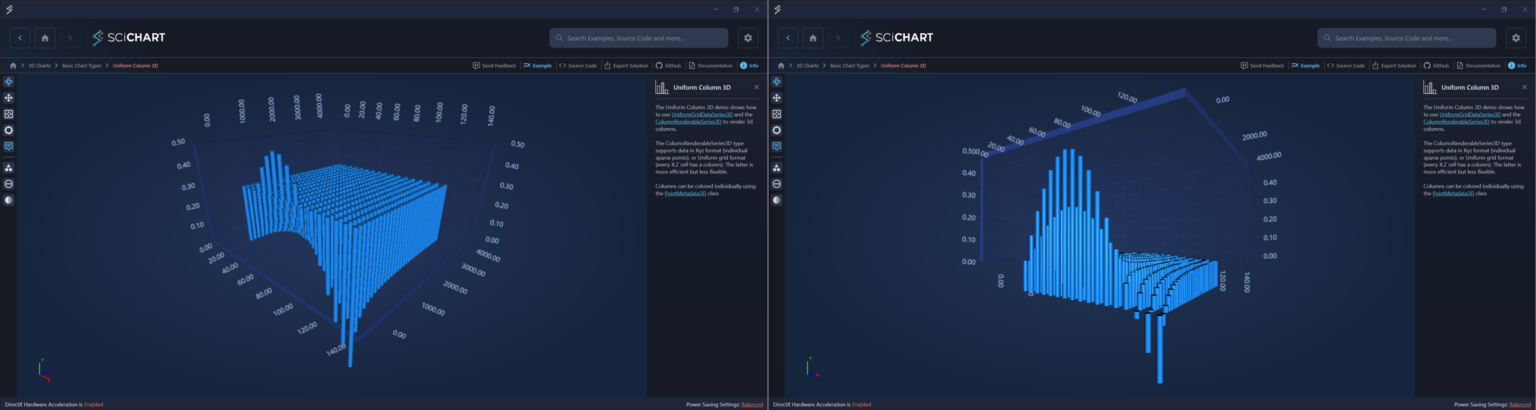
This can be achieved setting ZeroLineY property on ColumnRenderableSeries3D instance:
| Setting ZeroLineY property |
Copy Code |
|---|---|
<s3D:SciChart3DSurface.RenderableSeries> <!-- To create a 3D Columns Chart, create a ColumnRenderableSeries3D. Optionally specify ZeroLineY, ColumnShape, Opacity --> <s3D:ColumnRenderableSeries3D ZeroLineY="-0.15" DataPointWidthX="0.8" Opacity="1"/> </s3D:SciChart3DSurface.RenderableSeries> | |