
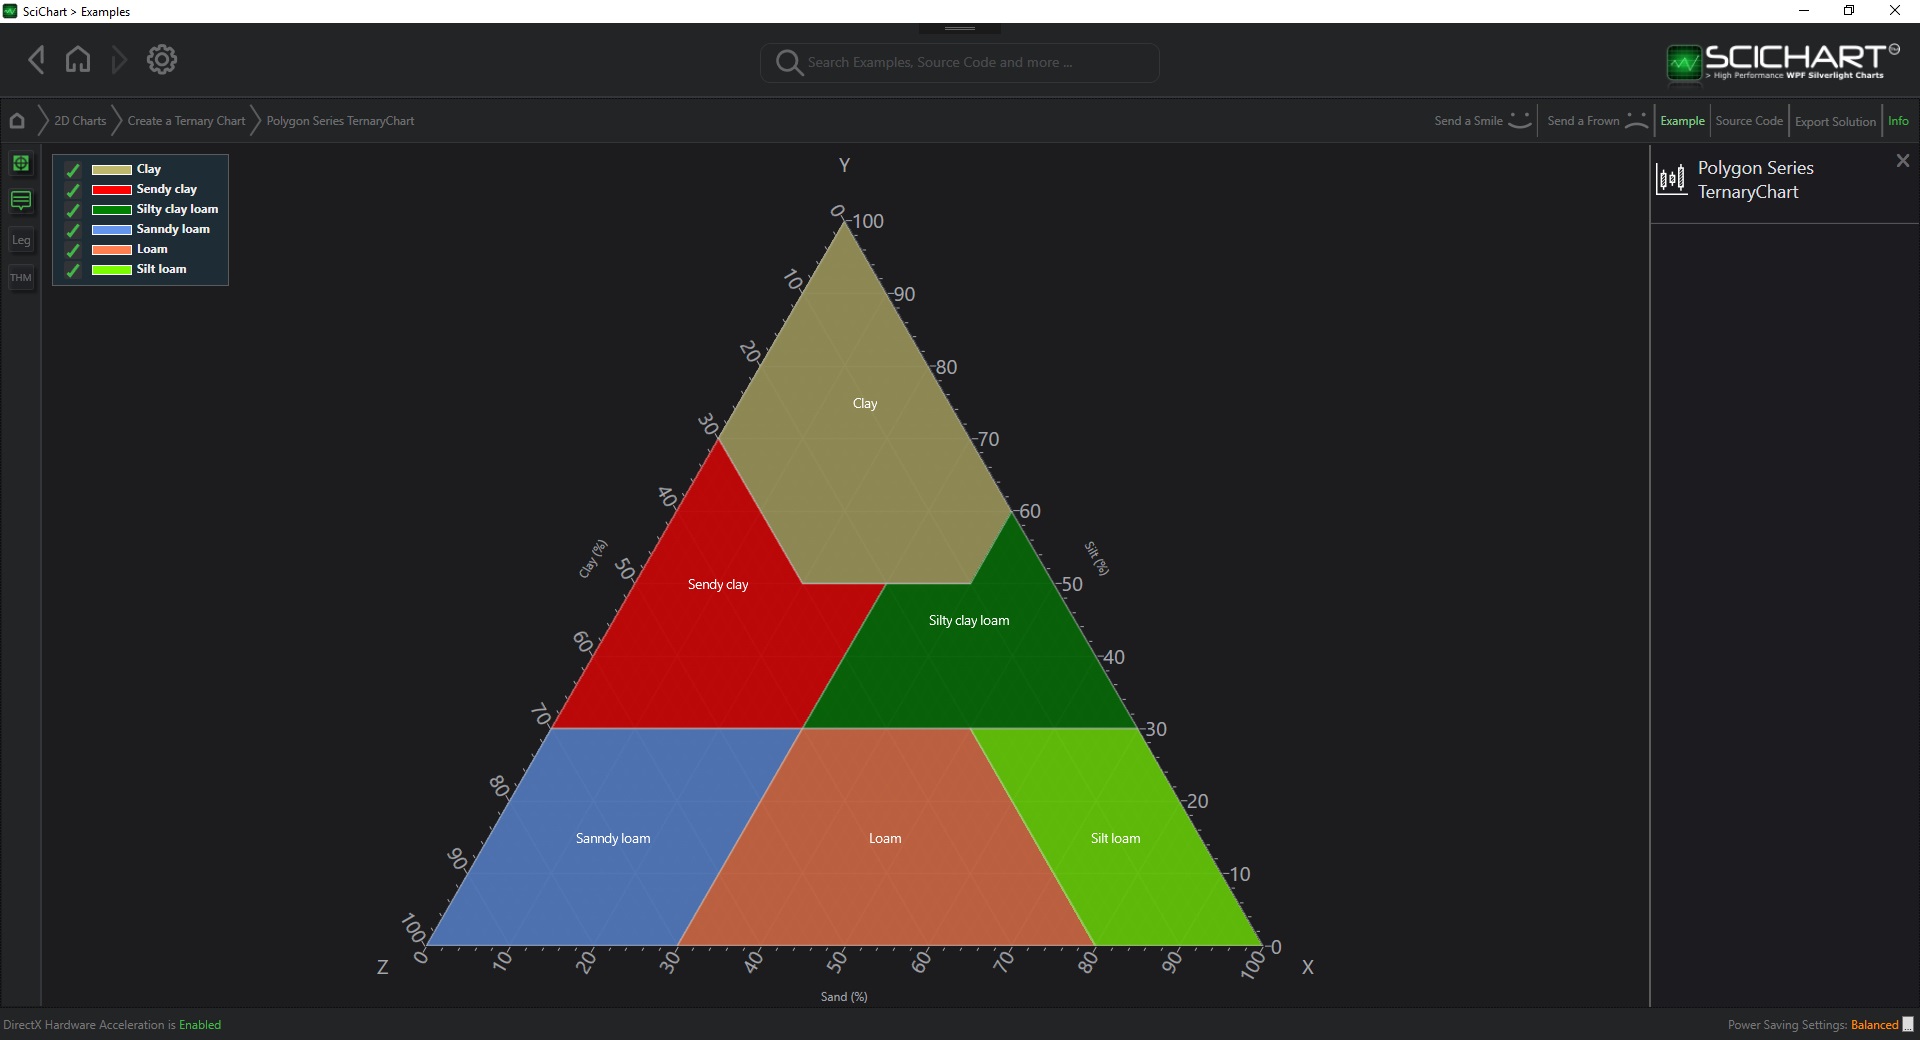
The Ternary Polygon Type
Ternary Polygon Series are provided by the TernaryPolygonRenderableSeries type. This draws a polygon between lines connected with series points.
To declare a TernaryPolygonRenderableSeries, use the following code:
Declare a TernaryPolygonRenderableSeries in Xaml / Code Behind
| Declare a TernaryPolygonRenderableSeries |
Copy Code |
|---|---|
<!-- where xmlns:s="http://schemas.abtsoftware.co.uk/scichart" --> <s:SciChartTernarySurface> <s:SciChartTernarySurface.RenderableSeries> <s:TernaryPolygonRenderableSeries x:Name="polygonSeries" Fill="Red" Opacity="0.7" Stroke="White" StrokeThickness="1" /> </s:SciChartTernarySurface.RenderableSeries> </s:SciChartTernarySurface> // Code Behind, e.g. in OnLoaded event handler, set the DataSeries var polygonDataSeries = new XyzDataSeries<double> { AcceptsUnsortedData = true }; polygonDataSeries.Append(0, 100, 0); polygonDataSeries.Append(40, 60, 0); polygonDataSeries.Append(40, 50, 10); polygonDataSeries.Append(20, 50, 30); polygonDataSeries.Append(0, 70, 30); polygonDataSeries.DataSeries = polygonDataSeries; | |
Declare a TernaryPolygonRenderableSeries in Pure Code
| Declare a TernaryPolygonRenderableSeries |
Copy Code |
|---|---|
// Declare the SciChartTernarySurface var sciChartTeranrySurface = new SciChartTernarySurface(); // ... // Declare and add a Ternary Error Bar Series var ternaryErrorBarSeries = new TernaryPolygonRenderableSeries { Fill = Brushes.Red, Opacity = 0.7, Stroke = Colors.White, StrokeThickness = 1 }; // Set some data var polygonDataSeries = new XyzDataSeries<double> { AcceptsUnsortedData = true }; polygonDataSeries.Append(0, 100, 0); polygonDataSeries.Append(40, 60, 0); polygonDataSeries.Append(40, 50, 10); polygonDataSeries.Append(20, 50, 30); polygonDataSeries.Append(0, 70, 30); polygonDataSeries.DataSeries = polygonDataSeries; | |
NOTE: You can also declare RenderableSeries using full MVVM (series ViewModels). Please see MVVM DataSeries / RenderableSeries APIAPI for more details.
See Also