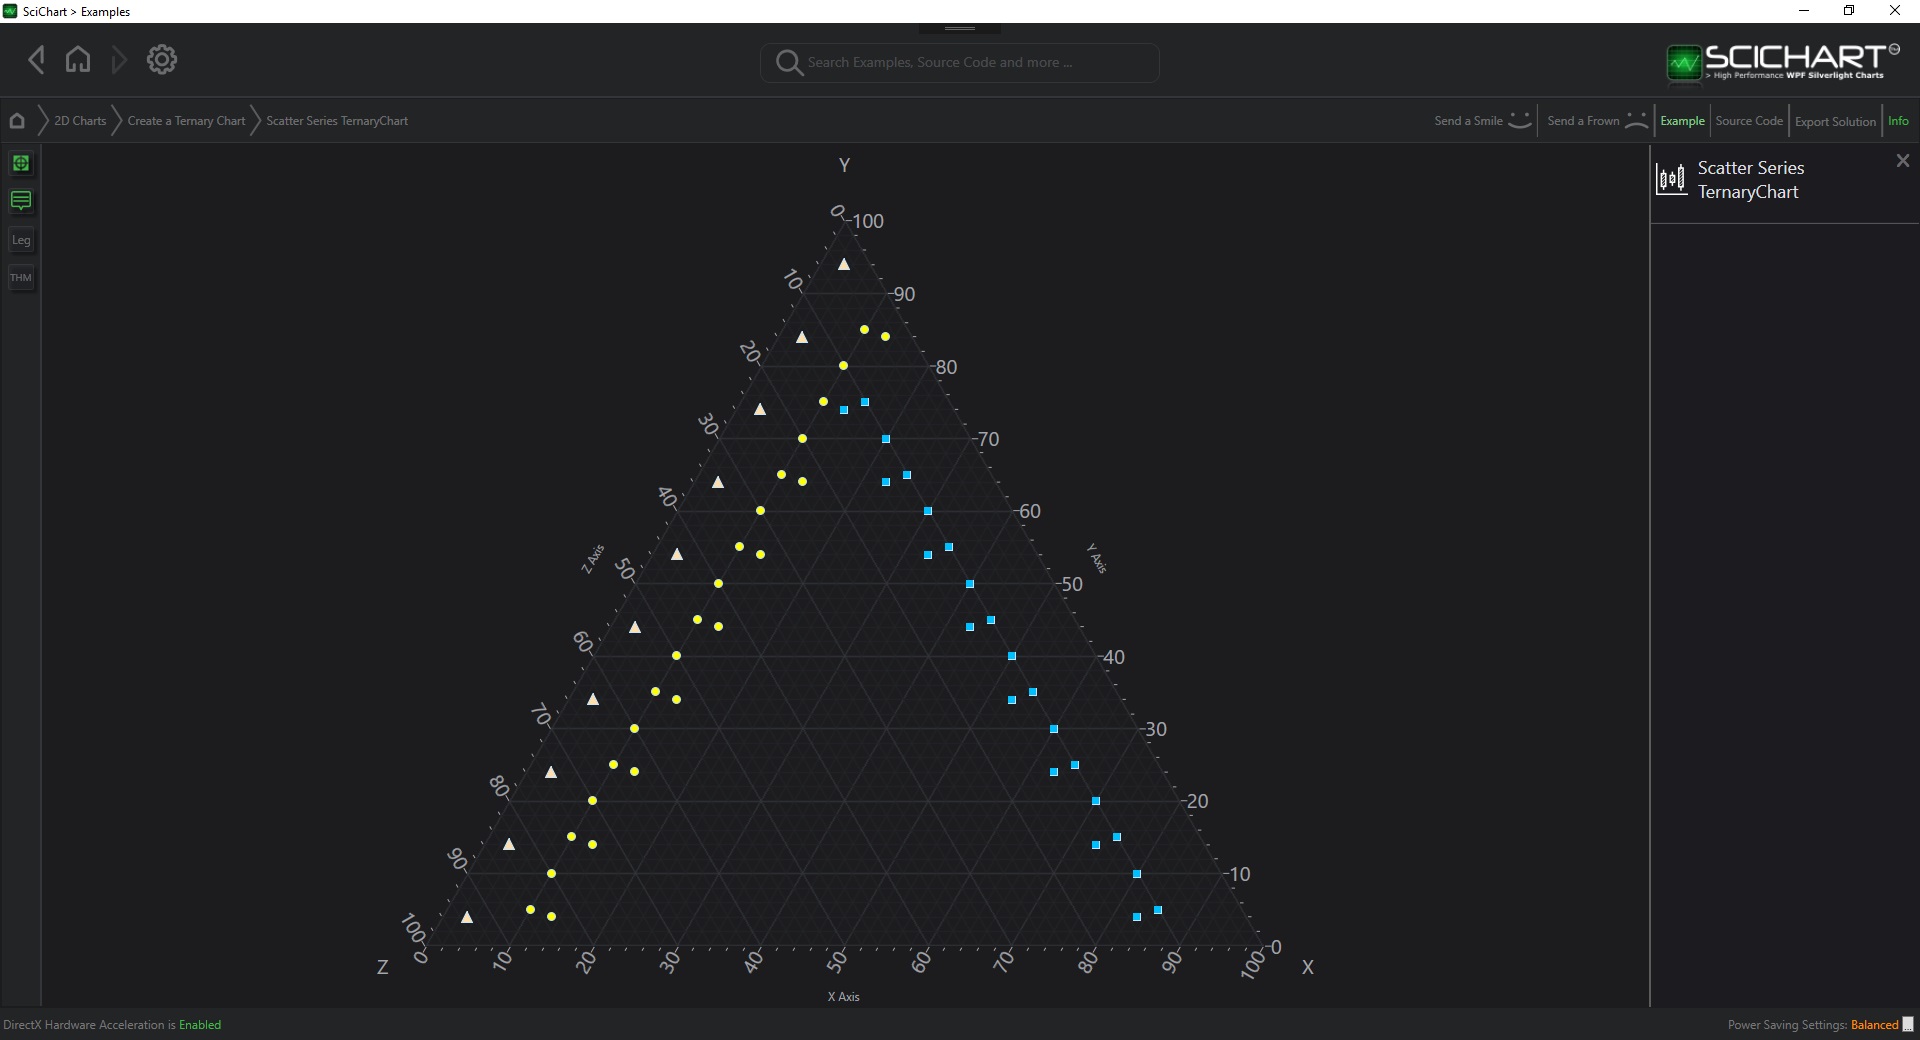
The Ternary Scatter Type
Ternary Scatter Series are provided by the TernaryScatterRenderableSeries type, which requires a PointMarker.
NOTE: For a detailed description of the PointMarker API, see Section Point Marker API-BaseRenderableSeries.Pointmarker

PointMarker Types available in SciChart include:
- EllipsePointMarker– draws an ellipse with stroke/fill
- SquarePointMarker– draws a cube with stroke/fill
- TrianglePointMarker– draws a triangle with stroke/fill
- CrossPointMarker– draws a + sign with stroke
- XPointMarker– draws an x sign with stroke
- InvertedTrianglePointMarker– draws an inverted triangle with stroke/fill
- FrameworkElementSprite(allows any UIElement to be turned into a PointMarker)
- BitmapSpriteBase(allows drawing using our RenderContext API as a PointMarker)
To declare a TernaryScatterRenderableSeries with PointMarker, use the following code:
Declare a TernaryScatterRenderableSeries with EllipsePointMarker in Xaml / Code Behind
| Declare a TernaryScatterRenderableSeries with EllipsePointMarker |
Copy Code |
|---|---|
<!-- where xmlns:s="http://schemas.abtsoftware.co.uk/scichart" --> <s:SciChartTernarySurface> <s:SciChartTernarySurface.RenderableSeries> <s:TernaryScatterRenderableSeries x:Name="scatterSeries"> <s:TernaryScatterRenderableSeries.PointMarker> <s:EllipsePointMarker Width="7" Height="7" Fill="Yellow" /> </s:TernaryScatterRenderableSeries.PointMarker> </s:TernaryScatterRenderableSeries> </s:SciChartTernarySurface.RenderableSeries> </s:SciChartTernarySurface> // Code Behind, e.g. in OnLoaded event handler, set the DataSeries var scatterDataSeries = new XyzDataSeries<double, double, double>(); scatterDataSeries.Append(15, 75, 10); scatterDataSeries.Append(25, 65, 10); scatterDataSeries.Append(35, 55, 10); scatterDataSeries.Append(45, 45, 10); scatterSeries.DataSeries = scatterDataSeries; | |
Declare a TernaryScatterRenderableSeries with EllipsePointMarker in Pure Code
| Declare a TernaryScatterRenderableSeries with EllipsePointMarker |
Copy Code |
|---|---|
// Declare the SciChartTernarySurface var sciChartTeranrySurface = new SciChartTernarySurface(); // ... // Declare and add a Ternary Scatter Series var ternaryScatterSeries = new TernaryScatterRenderableSeries { PointMarker = { Width = 7, Height = 7, Fill = Colors.Yellow } }; // Set some data var scatterDataSeries = new XyzDataSeries<double, double, double>(); scatterDataSeries.Append(15, 75, 10); scatterDataSeries.Append(25, 65, 10); scatterDataSeries.Append(35, 55, 10); scatterDataSeries.Append(45, 45, 10); scatterSeries.DataSeries = scatterDataSeries; | |
NOTE: You can also declare RenderableSeries using full MVVM (series ViewModels). Please see MVVM DataSeries / RenderableSeries API for more details.
See Also
