Creating the Project Structure
We're going to start with a new blank project for this tutorial. If you haven't done so already, reference the SciChart DLLs by following the steps from Tutorial 01.
Next, we need a MainViewModel. Create a new class, call it MainViewModel and inherit BindableObject (a scichart base viewmodel class).
| MainViewMode.cs |
Copy Code |
|---|---|
using SciChart.Data.Model; namespace SciChart.Mvvm.Tutorial { // Create the MainViewModel. BindableObject is our own viewmodel base class in scichart. You can use your own! public class MainViewModel : BindableObject { private string _test; public MainViewModel() { TestString = "Hello MVVM World!"; } public string TestString { get { return _test; } set { _test = value; OnPropertyChanged("TestString"); } } } } | |
Next, in the XAML, lets instantiate our ViewModel and set it as DataContext for the view. We will also add a TextBlock to bind to the ViewModel property 'TestString' just to ensure the DataContext is setup correctly.
| MainView.xaml |
Copy Code |
|---|---|
<Window x:Class="SciChart.Mvvm.Tutorial.MainWindow" xmlns="http://schemas.microsoft.com/winfx/2006/xaml/presentation" xmlns:x="http://schemas.microsoft.com/winfx/2006/xaml" xmlns:d="http://schemas.microsoft.com/expression/blend/2008" xmlns:mc="http://schemas.openxmlformats.org/markup-compatibility/2006" xmlns:local="clr-namespace:SciChart.Mvvm.Tutorial" mc:Ignorable="d" Title="MainWindow" Height="550" Width="800"> <Window.Resources> <local:MainViewModel x:Key="MainViewModel"/> </Window.Resources> <Grid DataContext="{StaticResource MainViewModel}"> <TextBlock Text="{Binding TestString}" FontSize="20"/> </Grid> </Window> | |
You should now see this.
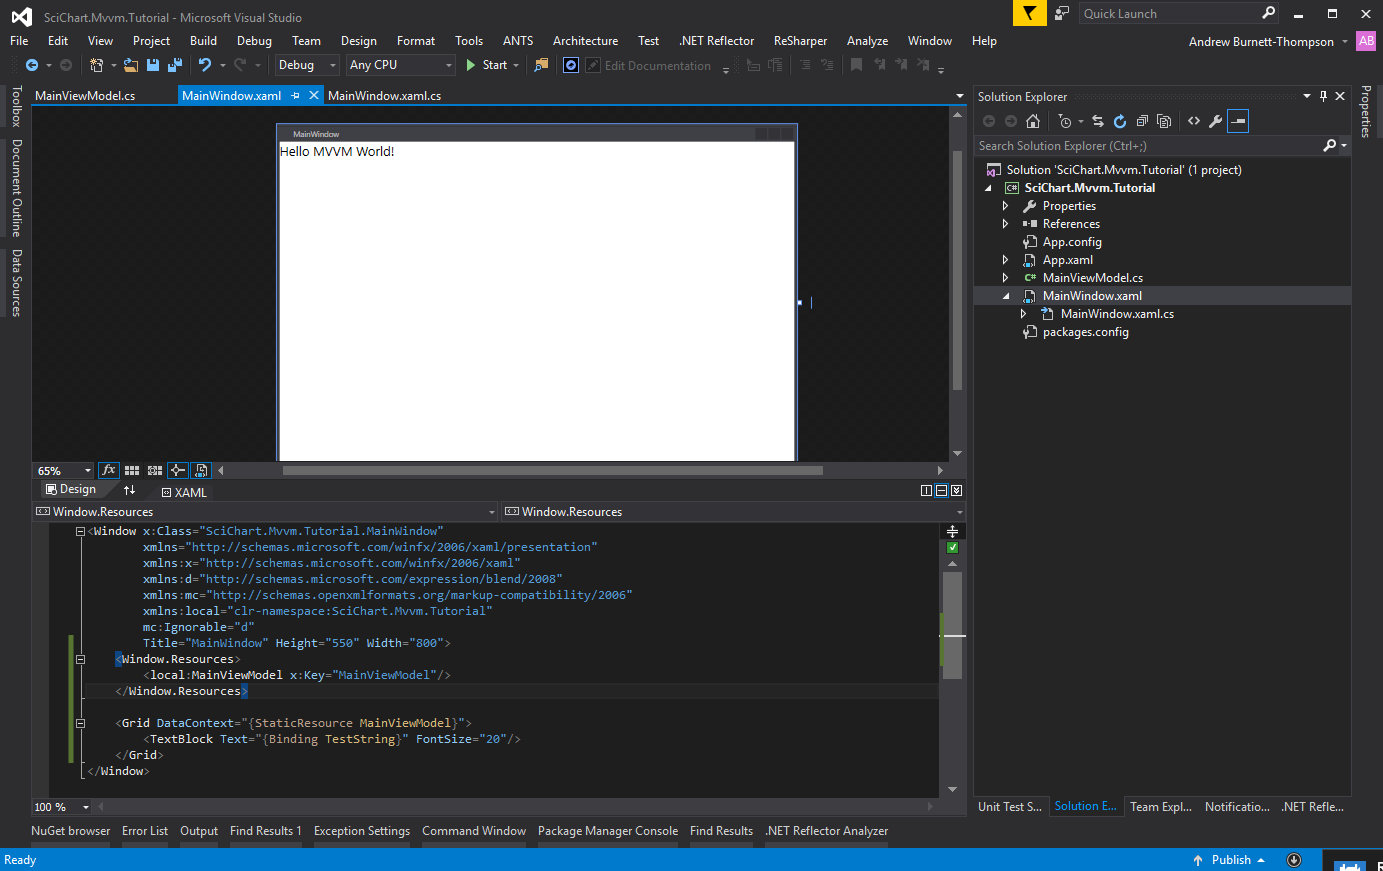
If so, everything is setup correctly! Let's move on to create our SciChartSurface.
Creating a SciChartSurface with MVVM
Modify your view code to include a SciChartSurface as follows:
| Including a SciChartSurface in Window.xaml |
Copy Code |
|---|---|
<Window x:Class="SciChart.Mvvm.Tutorial.MainWindow" xmlns="http://schemas.microsoft.com/winfx/2006/xaml/presentation" xmlns:x="http://schemas.microsoft.com/winfx/2006/xaml" xmlns:d="http://schemas.microsoft.com/expression/blend/2008" xmlns:mc="http://schemas.openxmlformats.org/markup-compatibility/2006" xmlns:local="clr-namespace:SciChart.Mvvm.Tutorial" xmlns:s="http://schemas.abtsoftware.co.uk/scichart" mc:Ignorable="d" Title="MainWindow" Height="550" Width="800"> <Window.Resources> <local:MainViewModel x:Key="MainViewModel"/> </Window.Resources> <Grid DataContext="{StaticResource MainViewModel}"> <!-- Bind to ChartViewModel.ChartTitle etc --> <s:SciChartSurface ChartTitle="{Binding ChartTitle}"> <s:SciChartSurface.XAxis> <s:NumericAxis AxisTitle="{Binding XAxisTitle}"/> </s:SciChartSurface.XAxis> <s:SciChartSurface.YAxis> <s:NumericAxis AxisTitle="{Binding YAxisTitle}"/> </s:SciChartSurface.YAxis> </s:SciChartSurface> </Grid> </Window> | |
In the ViewModel, add properties for the ChartTitle, XAxisTitle and YAxisTitle.
| MainViewModel |
Copy Code |
|---|---|
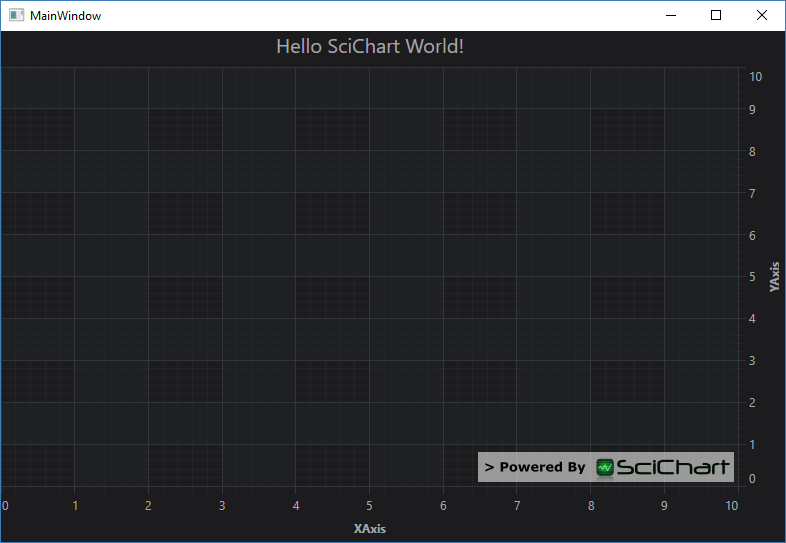
using System.Collections.ObjectModel; using System.Windows.Media; using SciChart.Charting.Model.ChartSeries; using SciChart.Charting.Model.DataSeries; using SciChart.Data.Model; namespace SciChart.Mvvm.Tutorial { public class MainViewModel : BindableObject { private string _chartTitle = "Hello SciChart World!"; private string _xAxisTitle = "XAxis"; private string _yAxisTitle = "YAxis"; public string ChartTitle { get { return _chartTitle; } set { _chartTitle = value; OnPropertyChanged("ChartTitle"); } } public string XAxisTitle { get { return _xAxisTitle; } set { _xAxisTitle = value; OnPropertyChanged("XAxisTitle"); } } public string YAxisTitle { get { return _yAxisTitle; } set { _yAxisTitle = value; OnPropertyChanged("YAxisTitle"); } } } } | |
Running the application, you should now see this.