
Tutorial 03 - Adding Series to a Chart
Adding Series to a SciChartSurface
Source code for this tutorial can be found at our SciChart.WPF.Examples Github Repository under Tutorials section.
Following on from Tutorial 02 - Creating a SciChartSurface where we created the chart control, added an XAxis and a YAxis, we will now add a some Series with some data to the chart.
Declaring a RenderableSeries in XAML
To draw a Line and Scatter series on the chart, we need to define two RenderableSeries, and two DataSeries to hold the data.
First, lets declare the RenderableSeries in XAML:
| Adding Series to the Chart |
Copy Code |
|---|---|
<Window x:Class="SciChart.Tutorial.MainWindow" xmlns="http://schemas.microsoft.com/winfx/2006/xaml/presentation" xmlns:x="http://schemas.microsoft.com/winfx/2006/xaml" xmlns:d="http://schemas.microsoft.com/expression/blend/2008" xmlns:mc="http://schemas.openxmlformats.org/markup-compatibility/2006" xmlns:s="http://schemas.abtsoftware.co.uk/scichart" mc:Ignorable="d" Title="MainWindow" Height="350" Width="525"> <Grid> <s:SciChartSurface x:Name="sciChartSurface"> <!-- Define RenderableSeries --> <!-- where xmlns:s="http://schemas.abtsoftware.co.uk/scichart" --> <s:SciChartSurface.RenderableSeries> <s:FastLineRenderableSeries x:Name="LineSeries" Stroke="#FF4083B7"/> <s:XyScatterRenderableSeries x:Name="ScatterSeries" > <s:XyScatterRenderableSeries.PointMarker> <s:EllipsePointMarker Width="7" Height="7" Fill="#FFF" Stroke="SteelBlue"/> </s:XyScatterRenderableSeries.PointMarker> </s:XyScatterRenderableSeries> </s:SciChartSurface.RenderableSeries> <s:SciChartSurface.XAxis> <s:NumericAxis AxisTitle="Number of Samples (per Series)"/> </s:SciChartSurface.XAxis> <s:SciChartSurface.YAxis> <s:NumericAxis AxisTitle="Value"/> </s:SciChartSurface.YAxis> <s:SciChartSurface.ChartModifier> <s:ModifierGroup> <s:RubberBandXyZoomModifier /> <s:ZoomExtentsModifier /> </s:ModifierGroup> </s:SciChartSurface.ChartModifier> <s:SciChartSurface.Annotations> <s:TextAnnotation Text="Hello world!" X1="5.0" Y1="5"/> </s:SciChartSurface.Annotations> </s:SciChartSurface> </Grid> </Window> | |
For these series to show, we need to add some data to the chart. We're going to do this in code-behind.
| Create Data for the Charts |
Copy Code |
|---|---|
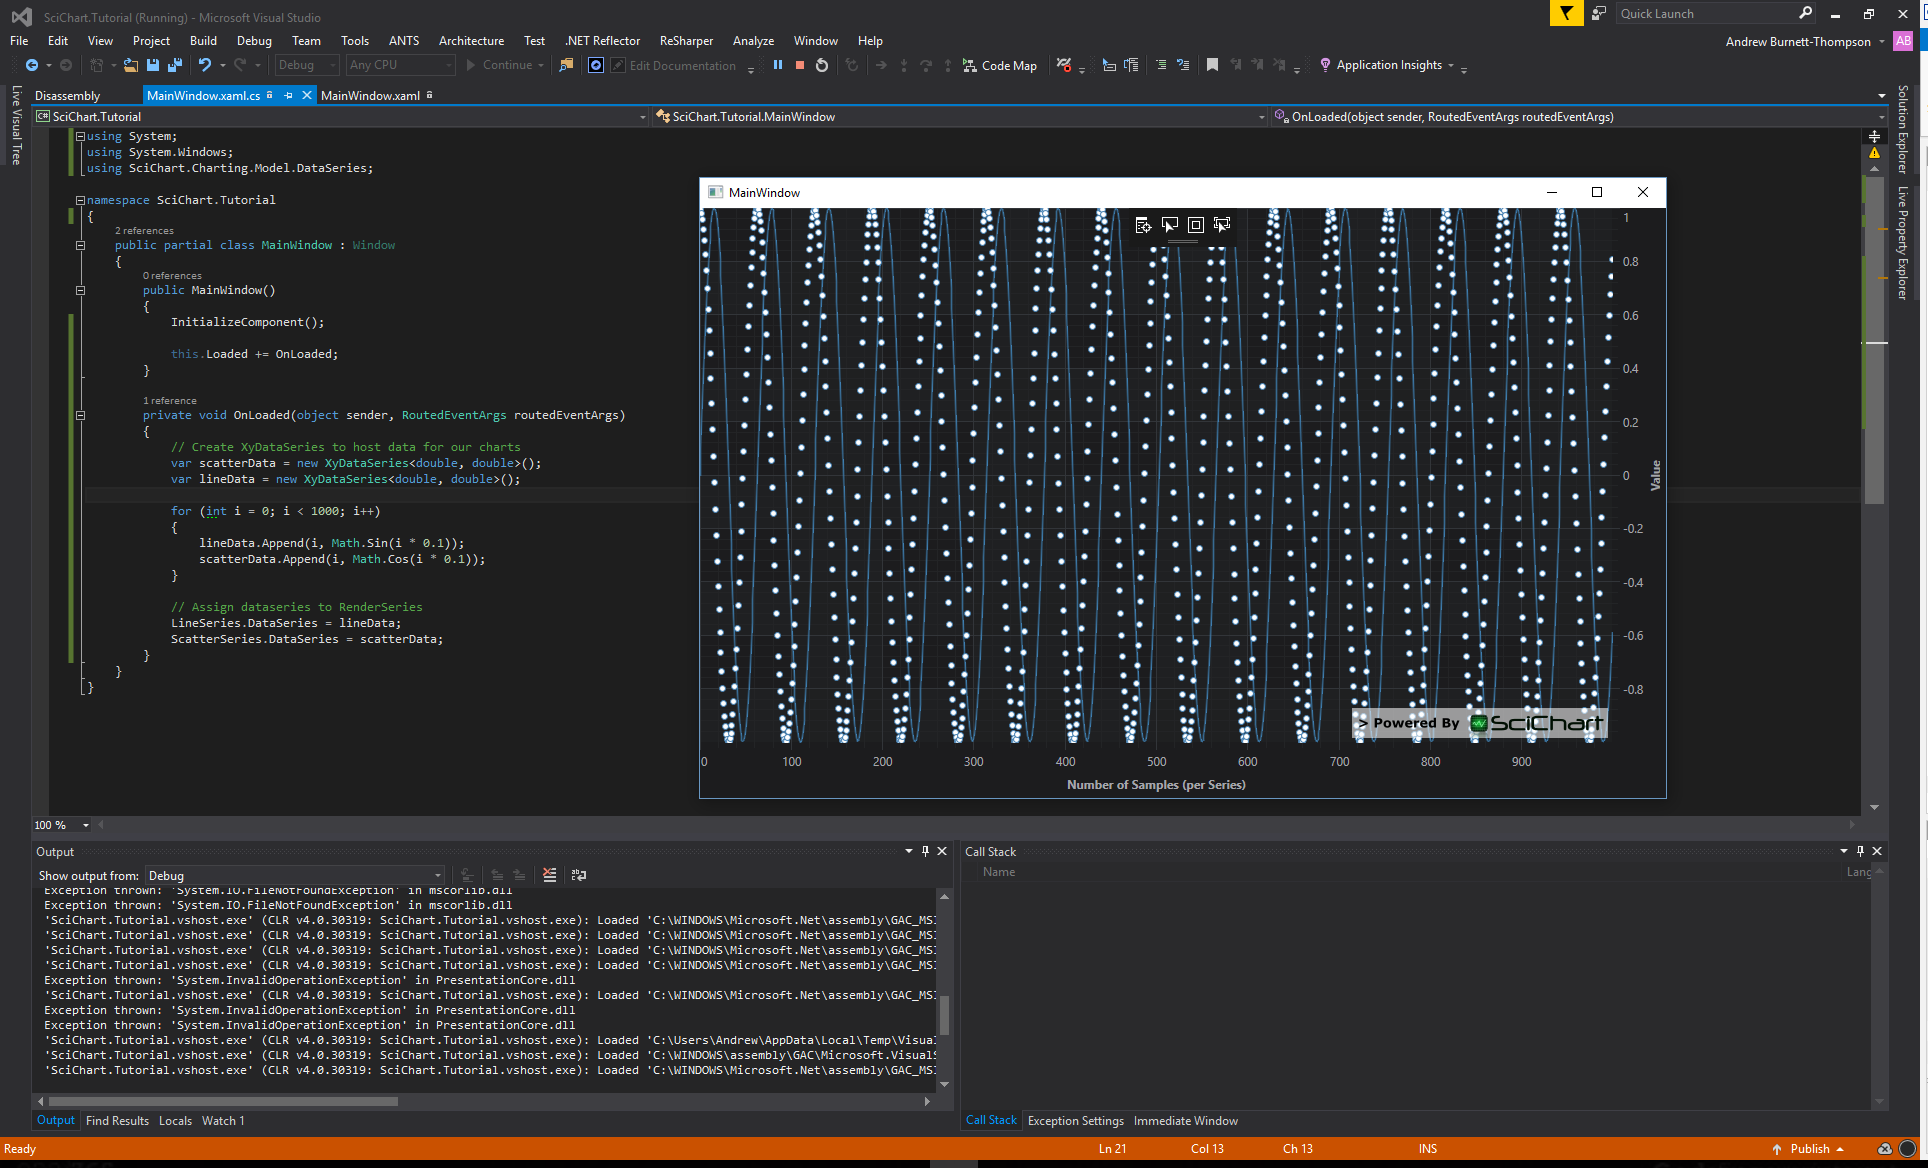
using System; using System.Windows; using SciChart.Charting.Model.DataSeries; namespace SciChart.Tutorial { public partial class MainWindow : Window { public MainWindow() { InitializeComponent(); this.Loaded += OnLoaded; } private void OnLoaded(object sender, RoutedEventArgs routedEventArgs) { // Create XyDataSeries to host data for our charts var scatterData = new XyDataSeries<double, double>(); var lineData = new XyDataSeries<double, double>(); for (int i = 0; i < 1000; i++) { lineData.Append(i, Math.Sin(i * 0.1)); scatterData.Append(i, Math.Cos(i * 0.1)); } // Assign dataseries to RenderSeries LineSeries.DataSeries = lineData; ScatterSeries.DataSeries = scatterData; } } } | |
Congratulations! You now have added some series to a chart!
Further Reading
Each series type deserves an article in itself! For further reading, please see the articles below:
- FastLineRenderableSeries - The Line Series Type
- XyScatterRenderableSeries - The Scatter Series Type
- PointMarker API - adding data point markers
See Also