So far all the tutorials in this series have focused on static charts where the data doesn't change.
Assuming you have completed Tutorial 05 - Adding Tooltips and Legends, we will now make some changes to update the data dynamically.
Updating Data Values
SciChart has the concept of RenderableSeries and DataSeries. RenderableSeries present the data, while DataSeries hold the X,Y data and manage updates.
Our MainWindow.Loaded event handler currently looks like this:
| MainWindow.Loaded BEFORE modification for realtime |
Copy Code |
|---|---|
private void OnLoaded(object sender, RoutedEventArgs routedEventArgs) { var scatterData = new XyDataSeries<double, double>(); var lineData = new XyDataSeries<double, double>(); scatterData.SeriesName = "Cos(x)"; lineData.SeriesName = "Sin(x)"; for (int i = 0; i < 1000; i++) { lineData.Append(i, Math.Sin(i * 0.1)); scatterData.Append(i, Math.Cos(i * 0.1)); } LineSeries.DataSeries = lineData; ScatterSeries.DataSeries = scatterData; } | |
This creates some DataSeries and appends some static data. Now let's animate it.
We will create a DispatcherTimer in our Loaded event handler right after creating and setting the dataseries above. Inside there we will call DataSeries.SuspendUpdates and XyDataSeries.Update to change the data. SciChart automatically redraws when the data is changed.
| MainWindow.Loaded AFTER modification for realtime |
Copy Code |
|---|---|
private void OnLoaded(object sender, RoutedEventArgs routedEventArgs) { var scatterData = new XyDataSeries<double, double>(); var lineData = new XyDataSeries<double, double>(); // Ensure that DataSeries are named for the legend scatterData.SeriesName = "Cos(x)"; lineData.SeriesName = "Sin(x)"; for (int i = 0; i < 1000; i++) { lineData.Append(i, Math.Sin(i * 0.1)); scatterData.Append(i, Math.Cos(i * 0.1)); } LineSeries.DataSeries = lineData; ScatterSeries.DataSeries = scatterData; // Start a timer to update our data double phase = 0.0; var timer = new DispatcherTimer(DispatcherPriority.Render); timer.Interval = TimeSpan.FromMilliseconds(10); timer.Tick += (s, e) => { // SuspendUpdates() ensures the chart is frozen // while you do updates. This ensures best performance using (lineData.SuspendUpdates()) using (scatterData.SuspendUpdates()) { for (int i = 0; i < 1000; i++) { // Updates the Y value at index i lineData.Update(i, Math.Sin(i * 0.1 + phase)); scatterData.Update(i, Math.Cos(i * 0.1 + phase)); } } phase += 0.01; }; timer.Start(); } | |
To make things a little bit more readable, we will also make onesmall changes in XAML to add some padding to the YAxis as well as a default VisibleRange.
| Realtime Updates: Xaml |
Copy Code |
|---|---|
...
            <s:SciChartSurface.YAxis>
                <!-- Set GrowBy which adds padding above below the YAxis -->
                <s:NumericAxis AxisTitle="Value" VisibleRange="-1.1, 1.1" GrowBy="0.1,0.1"/>
            </s:SciChartSurface.YAxis>
... | |
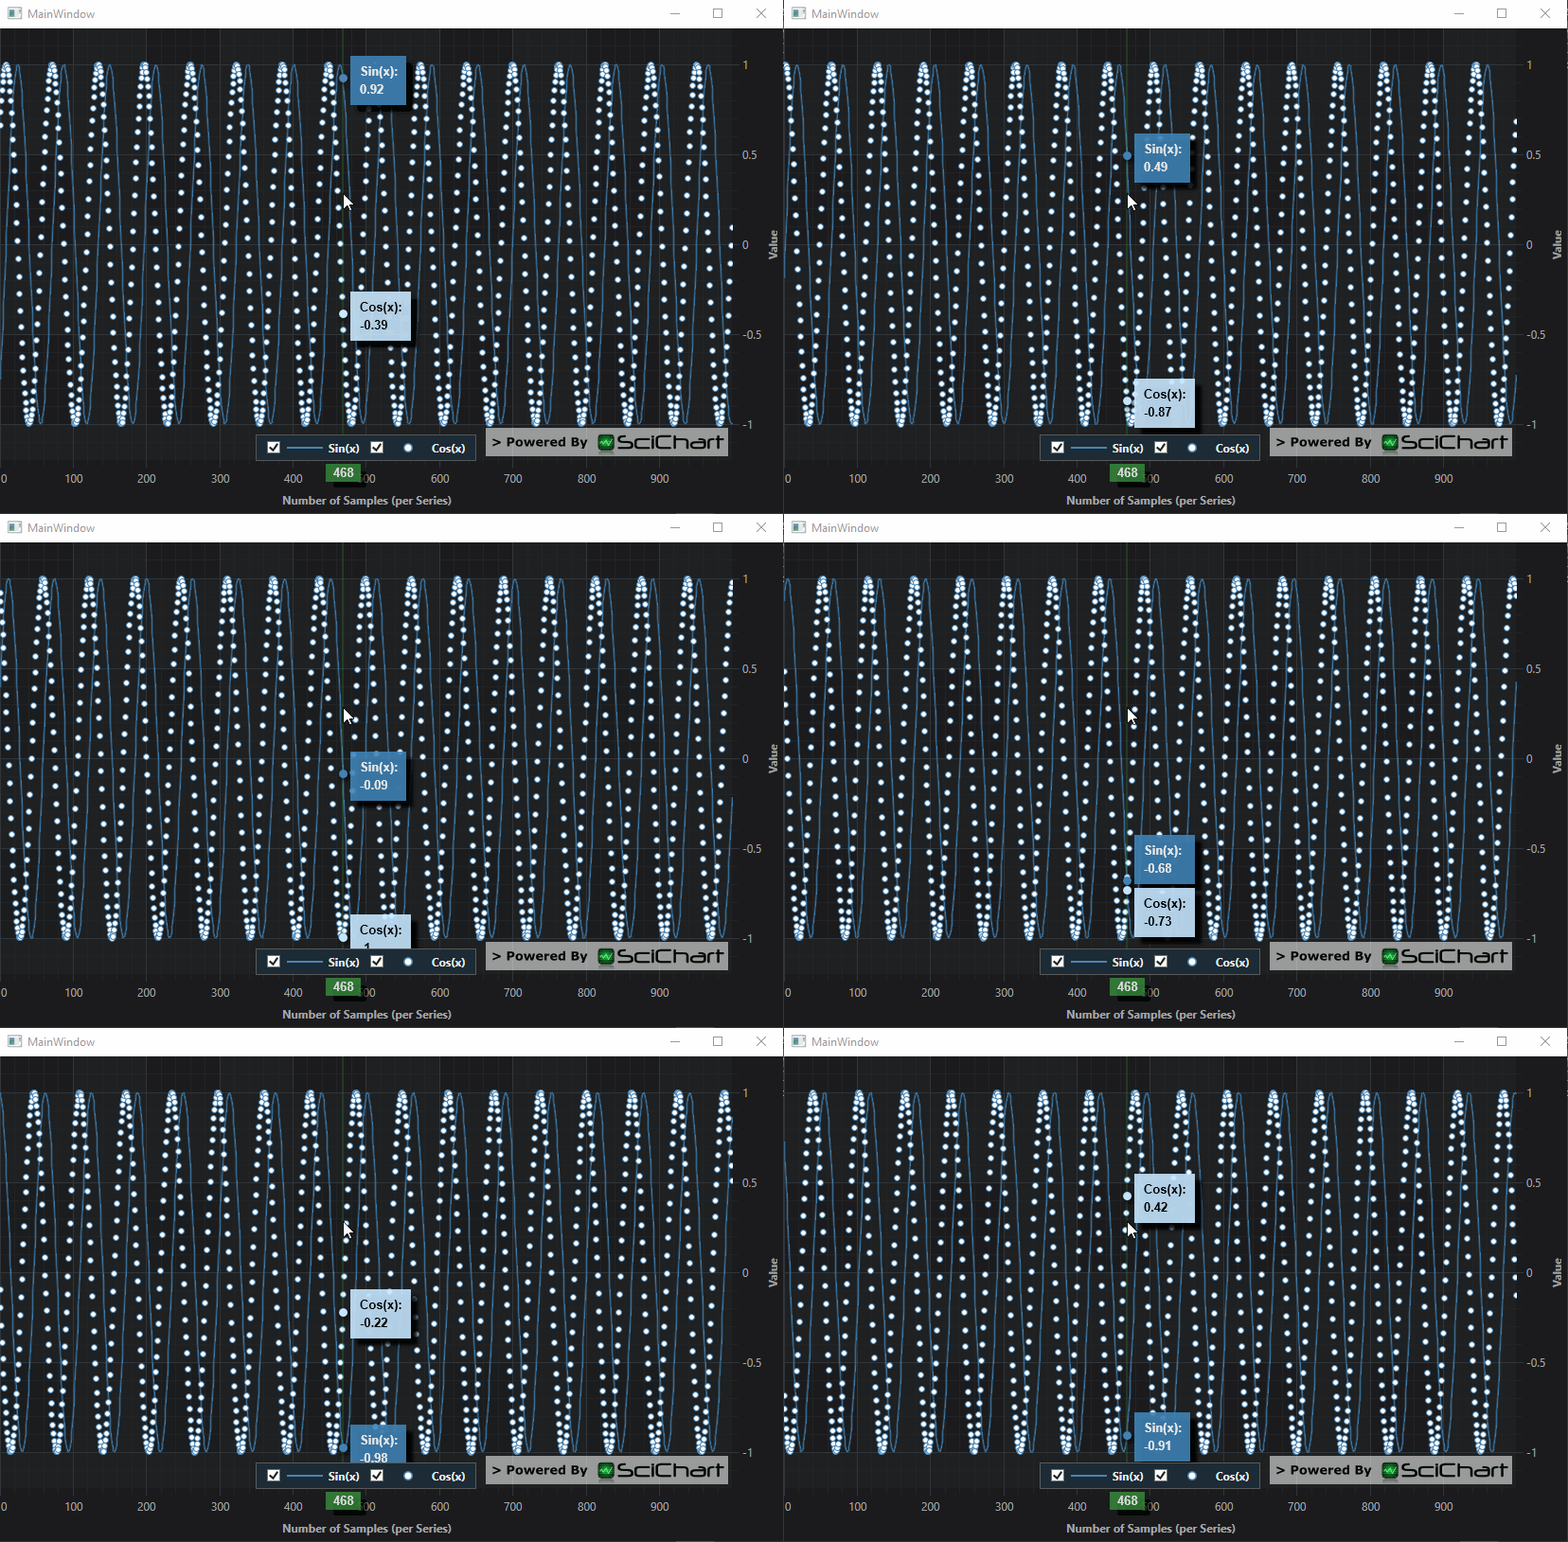
Now run the Application. You should see this!

Appending Data Values
As well as using DataSeries.Update, you can also use DataSeries.Append to add new data-values to a DataSeries. Make some changes to your MainWindow.OnLoaded handler as follows:
| DispatcherTimer.Tick Handler for Appending Data |
Copy Code |
|---|---|
private void OnLoaded(object sender, RoutedEventArgs routedEventArgs) { var scatterData = new XyDataSeries<double, double>(); var lineData = new XyDataSeries<double, double>(); // Ensure that DataSeries are named for the legend scatterData.SeriesName = "Cos(x)"; lineData.SeriesName = "Sin(x)"; LineSeries.DataSeries = lineData; ScatterSeries.DataSeries = scatterData; // Start a timer to update our data var timer = new DispatcherTimer(DispatcherPriority.Render); timer.Interval = TimeSpan.FromMilliseconds(10); timer.Tick += (s, e) => { // This time we will append, not update. using (lineData.SuspendUpdates()) using (scatterData.SuspendUpdates()) { int i = lineData.Count; // Append a new data point; lineData.Append(i, Math.Sin(i * 0.1)); scatterData.Append(i, Math.Cos(i * 0.1)); // ZoomExtents after appending data. // Also see XAxis.AutoRange, and XAxis.VisibleRange for more options sciChartSurface.ZoomExtents(); } }; timer.Start(); } | |
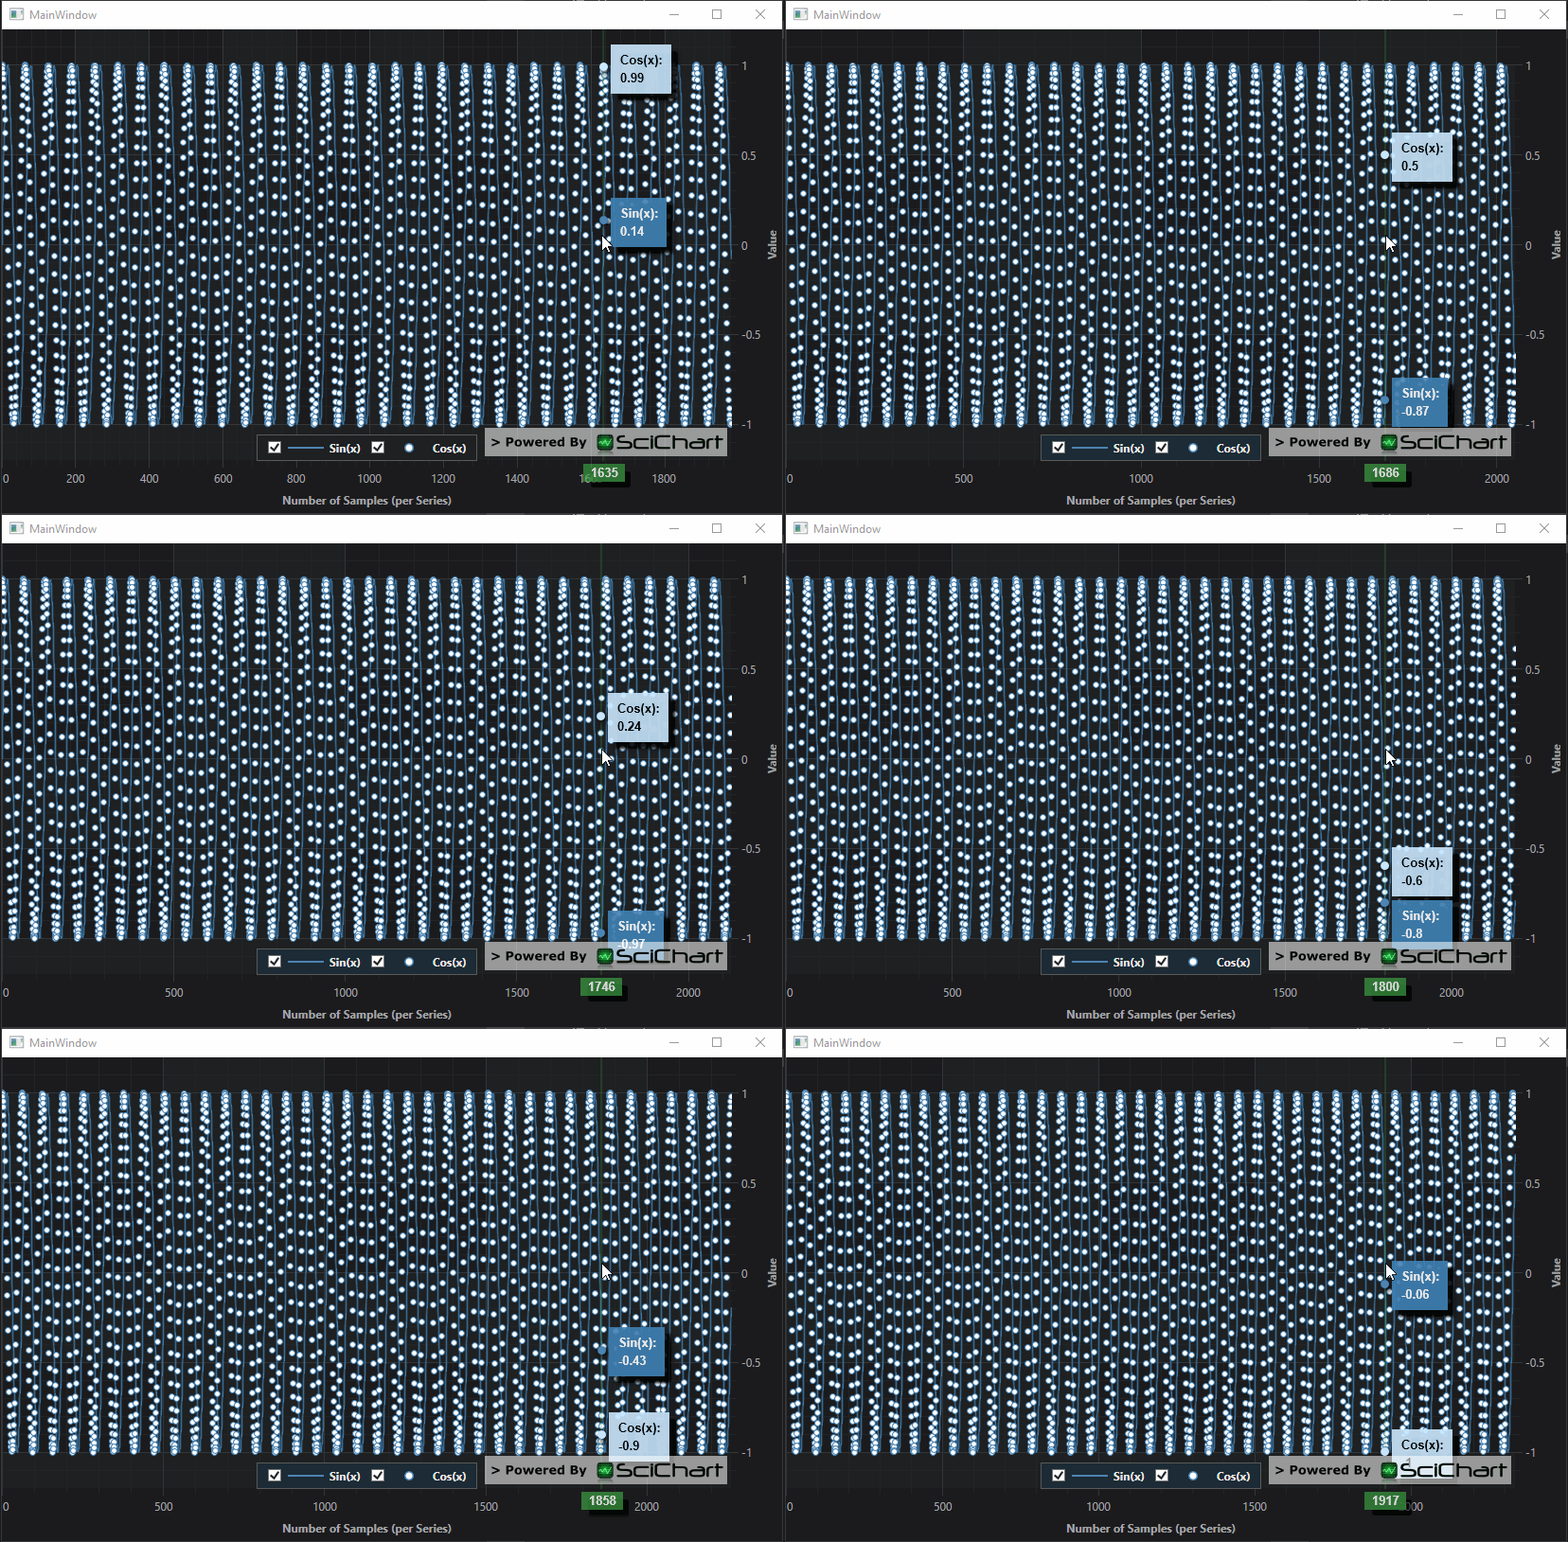
Now run the application again, you should now see the series growing larger as new data is appended.

Scrolling Realtime Charts
What if you wanted to scroll as new data was appended? You have a few choices.
- If you want to be memory efficient, and you don't mind if you discard old data, you can use our FIFO (first-in-first-out) functionality.
- If you want to preserve old data, you can simply update the XAxis.VisibleRange.
We're going to show you both techniques below.
Discarding Data when Scrolling using FifoCapacity
The most memory efficient way to achieve scrolling is to use DataSeries.FifoCapacity to set the maximum size of a DataSeries before old points are discarded.
DataSeries in FIFO mode act as a circular (first-in-first-out) buffer. Once the capacity is exceeded, old points are discarded.
You cannot zoom back to see the old points, once they are lost, they are lost.
To use FifoCapacity, we adust our MainWindow.Loaded event handler as follows:
| MainWindow.Loaded event handler for FIFO scrolling |
Copy Code |
|---|---|
private void OnLoaded(object sender, RoutedEventArgs routedEventArgs) { // Create DataSeries with FifoCapacity var scatterData = new XyDataSeries<double, double>() {SeriesName = "Cos(x)", FifoCapacity = 1000}; var lineData = new XyDataSeries<double, double>() { SeriesName = "Sin(x)", FifoCapacity = 1000}; // Assign DataSeries to RenderableSeries LineSeries.DataSeries = lineData; ScatterSeries.DataSeries = scatterData; int i = 0; // Start a timer to update our data var timer = new DispatcherTimer(DispatcherPriority.Render); timer.Interval = TimeSpan.FromMilliseconds(10); timer.Tick += (s, e) => { // This time we will append, not update. using (lineData.SuspendUpdates()) using (scatterData.SuspendUpdates()) { // Append a new data point; lineData.Append(i, Math.Sin(i * 0.1)); scatterData.Append(i, Math.Cos(i * 0.1)); // Set VisibleRange to last 1,000 points sciChartSurface.XAxis.VisibleRange = new DoubleRange(i-1000, i); i++; } }; timer.Start(); } | |
Hopefully, the code is self-explanatory. As a quick walkthrough we now create our XyDataSeries and set FifoCapacity = 1000. This tells SciChart after 1,000 points to start discarded old points (in a first-in-first-out fashion).
Next, inside the Timer.Tick handler we set the SciChartSurface.XAxis.VisibleRange to show the latest 1,000 points.
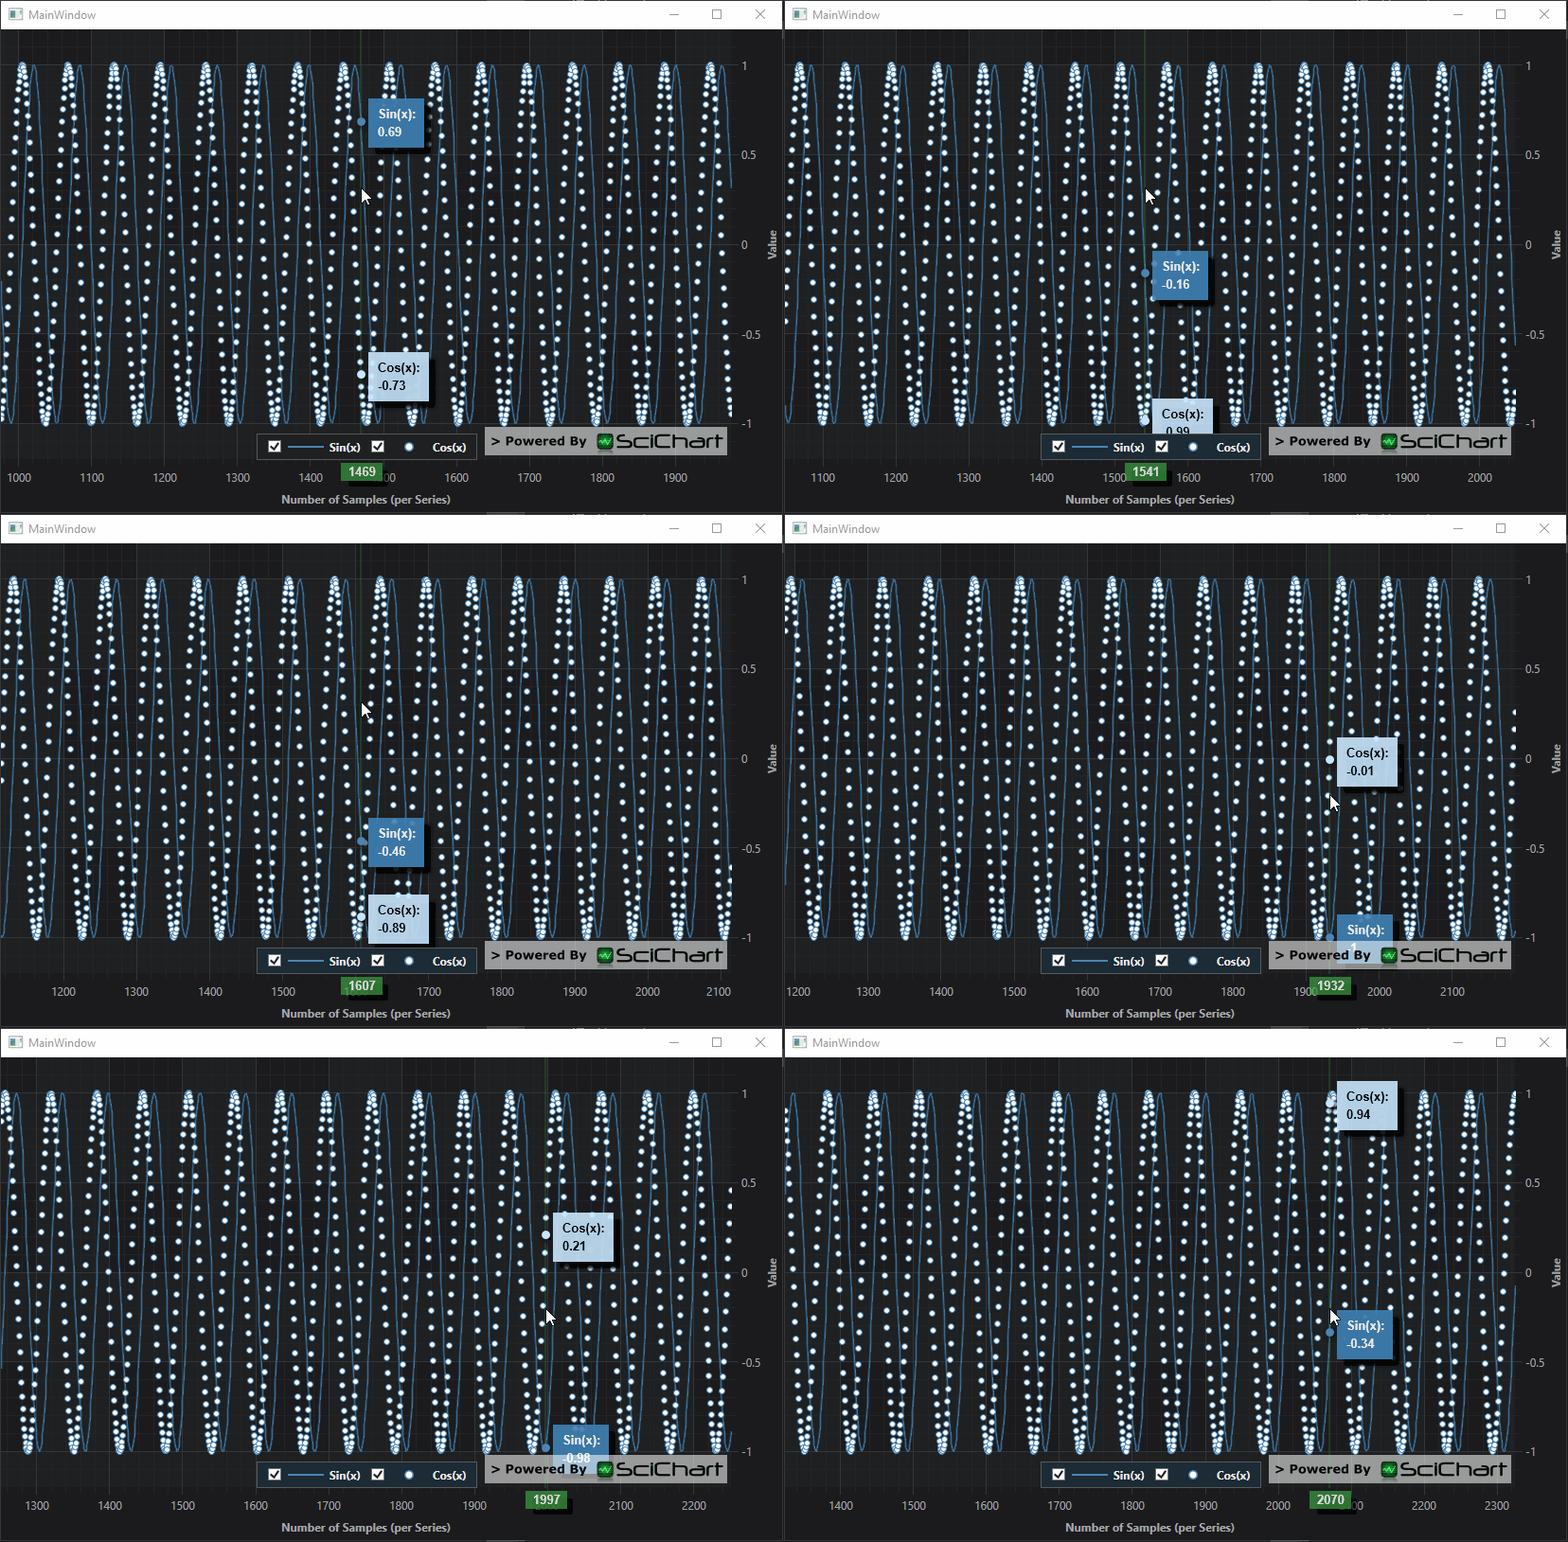
This should be the result when you run the application:

Preserving Old Data and Allowing Zooming
If you want to be able to retain all data on the chart, as well a zoom backwards and view old data, then you cannot use FifoCapacity.
Instead, we will use another technique.
Undo the changes you made above. First, remove the FIFO capacity from your MainWindow.Loaded handler.
| MainWindow.Loaded - remove FIFO Capacity |
Copy Code |
|---|---|
private void OnLoaded(object sender, RoutedEventArgs routedEventArgs) { // Create DataSeries with FifoCapacity var scatterData = new XyDataSeries<double, double>() { SeriesName = "Cos(x)", FifoCapacity = 1000 }; // REMOVE FIFOCAPACITY var lineData = new XyDataSeries<double, double>() { SeriesName = "Sin(x)", FifoCapacity = 1000 };// REMOVE FIFOCAPACITY | |
This change alone means old data is preserved, but we still can't zoom the realtime chart.
Next, remove the XAxis.VisibleRange setter in the Timer.Tick handler:
| Remove VisibleRange setter |
Copy Code |
|---|---|
// In timer.Tick handler, remove this line sciChartSurface.XAxis.VisibleRange = new DoubleRange(xMin, xMax); | |
Now, we are going to scroll using the ViewportManager. This is an API which allows you to control ranging and zooming on a fine level.
Create a new class with the following code.
| ScrollingViewportManager |
Copy Code |
|---|---|
using System; using SciChart.Charting.ViewportManagers; using SciChart.Charting.Visuals; using SciChart.Charting.Visuals.Axes; using SciChart.Data.Model; namespace SciChart.Tutorial { /// <summary> /// The following class will apply a scrolling window to the chart unles the user is zooming or panning /// </summary> public class ScrollingViewportManager : DefaultViewportManager { private readonly double _windowSize; public ScrollingViewportManager(double windowSize) { _windowSize = windowSize; } public override void AttachSciChartSurface(ISciChartSurface scs) { base.AttachSciChartSurface(scs); this.ParentSurface = scs; } public ISciChartSurface ParentSurface { get; private set; } protected override IRange OnCalculateNewXRange(IAxis xAxis) { // The Current XAxis VisibleRange var currentVisibleRange = xAxis.VisibleRange.AsDoubleRange(); if (ParentSurface.ZoomState == ZoomStates.UserZooming) return currentVisibleRange; // Don't scroll if user is zooming // The MaxXRange is the VisibleRange on the XAxis if we were to zoom to fit all data var maxXRange = xAxis.GetMaximumRange().AsDoubleRange(); double xMax = Math.Max(maxXRange.Max, currentVisibleRange.Max); // Scroll showing latest window size return new DoubleRange(xMax - _windowSize, xMax); } } } | |
Next, apply the ViewportManager to the SciChartSurface with the following code in your MainWindow.Loaded event handler:
| Applying the ViewportManager |
Copy Code |
|---|---|
private void OnLoaded(object sender, RoutedEventArgs routedEventArgs) { // Instantiate the ViewportManager here double windowSize = 1000.0; sciChartSurface.ViewportManager = new ScrollingViewportManager(windowSize); // Create DataSeries with FifoCapacity var scatterData = new XyDataSeries<double, double>() {SeriesName = "Cos(x)",}; var lineData = new XyDataSeries<double, double>() {SeriesName = "Sin(x)",}; ... | |
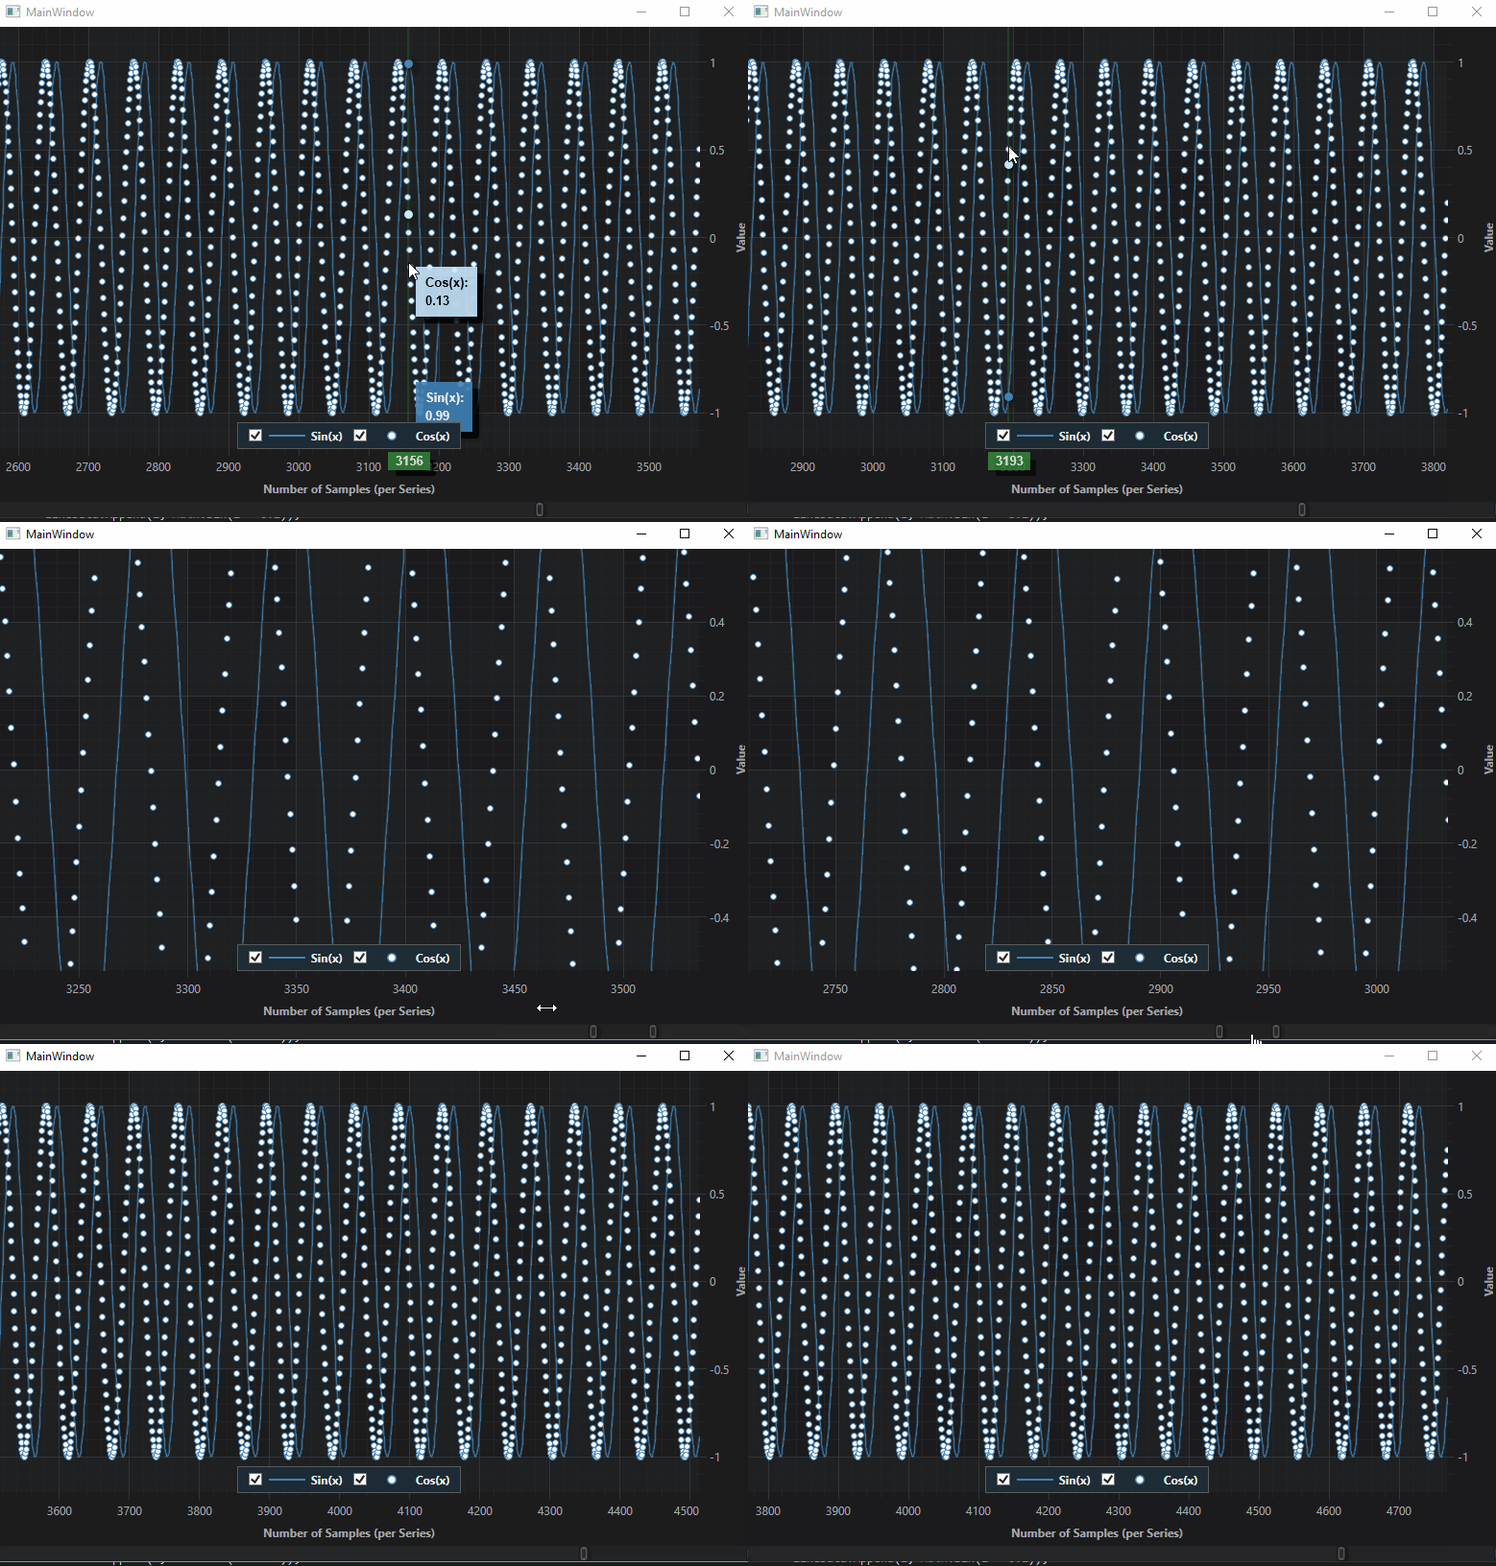
Now, start the application. The result can be seen below!

The Chart should now scroll showing the last 1,000 points. You can also
- Drag to zoom the chart
- Right-click drag to pan the chart
- Drag the XAxis to pan in X direction
- Drag the Scrollbar to pan in the X direction
Double click to reset zoom and resume scrolling.
Further Reading
- The ViewportManager API
- AutoRanging in SciChart
- Getting the best performance with our Performance Tips & Tricks
- Realtime examples in the SciChart WPF Examples Suite such as Oscilloscope, Spectrum Analyzer, and our Performance Demo
