
In the first tutorial: Creating a SciChartSurface, we touched on a powerful API - the Annotations API.
This API allows you to add UIElements to the chart: Lines, Text, Boxes, Arrows, custom Markers. The markers update as you zoom and pan the chart.
We're going to build on our previous Tutorial: Adding Realtime Updates to add annotations to a chart in a realtime context.
Revision from Previous Tutorials
First up, if your XAML and Code behind don't look like this then do some copy-pasting and get up to date. This is what your code should look like at the start of the tutorial.
| XAML - BEFORE adding annotations |
Copy Code |
|---|---|
<Window x:Class="SciChart.Tutorial.MainWindow" xmlns="http://schemas.microsoft.com/winfx/2006/xaml/presentation" xmlns:x="http://schemas.microsoft.com/winfx/2006/xaml" xmlns:d="http://schemas.microsoft.com/expression/blend/2008" xmlns:mc="http://schemas.openxmlformats.org/markup-compatibility/2006" xmlns:s="http://schemas.abtsoftware.co.uk/scichart" mc:Ignorable="d" Title="MainWindow" Height="550" Width="800"> <Grid Background="#222"> <Grid.RowDefinitions> <RowDefinition Height="*"/> <RowDefinition Height="Auto"/> </Grid.RowDefinitions> <s:SciChartSurface x:Name="sciChartSurface"> <s:SciChartSurface.RenderableSeries> <s:FastLineRenderableSeries x:Name="LineSeries" Stroke="#FF4083B7"/> <s:XyScatterRenderableSeries x:Name="ScatterSeries" > <s:XyScatterRenderableSeries.PointMarker> <s:EllipsePointMarker Width="7" Height="7" Fill="#FFF" Stroke="SteelBlue"/> </s:XyScatterRenderableSeries.PointMarker> </s:XyScatterRenderableSeries> </s:SciChartSurface.RenderableSeries> <s:SciChartSurface.XAxis> <s:NumericAxis AxisTitle="Number of Samples (per Series)"/> </s:SciChartSurface.XAxis> <s:SciChartSurface.YAxis> <s:NumericAxis AxisTitle="Value" GrowBy="0.1, 0.1" VisibleRange="-1.1, 1.1"/> </s:SciChartSurface.YAxis> <s:SciChartSurface.ChartModifier> <s:ModifierGroup> <s:RubberBandXyZoomModifier ExecuteOn="MouseLeftButton" RubberBandFill="#33FFFFFF" RubberBandStroke="#AAFFFFFF" RubberBandStrokeDashArray="2 2"/> <s:ZoomPanModifier ExecuteOn="MouseRightButton" ClipModeX="None" /> <s:YAxisDragModifier DragMode="Scale"/> <s:XAxisDragModifier DragMode="Pan"/> <s:MouseWheelZoomModifier/> <s:ZoomExtentsModifier ExecuteOn="MouseDoubleClick" /> <!-- NEW CODE HERE --> <!-- Add a Legend to the chart --> <!-- where xmlns:s="http://schemas.abtsoftware.co.uk/scichart" --> <s:LegendModifier ShowLegend="True" Orientation="Horizontal" VerticalAlignment="Bottom" HorizontalAlignment="Center" LegendPlacement="Inside" /> <!-- Add a RolloverModifier to the chart (shows vertical line tooltips --> <s:RolloverModifier ExecuteOn="MouseMove" ShowTooltipOn="MouseHover"/> <!-- END NEW CODE --> </s:ModifierGroup> </s:SciChartSurface.ChartModifier> <s:SciChartSurface.Annotations> <s:TextAnnotation Text="Hello world!" X1="5.0" Y1="5"/> </s:SciChartSurface.Annotations> </s:SciChartSurface> <s:SciChartScrollbar Grid.Row="1" Axis="{Binding ElementName=sciChartSurface, Path=XAxis}"/> </Grid> </Window> | |
| Code Behind - BEFORE adding Annotations |
Copy Code |
|---|---|
using System; using System.Windows; using System.Windows.Threading; using SciChart.Charting.Model.DataSeries; using SciChart.Data.Model; namespace SciChart.Tutorial { public partial class MainWindow : Window { public MainWindow() { InitializeComponent(); this.Loaded += OnLoaded; } private void OnLoaded(object sender, RoutedEventArgs routedEventArgs) { double windowSize = 1000.0; sciChartSurface.ViewportManager = new ScrollingViewportManager(windowSize); // Create DataSeries with FifoCapacity var scatterData = new XyDataSeries<double, double>() {SeriesName = "Cos(x)",}; var lineData = new XyDataSeries<double, double>() {SeriesName = "Sin(x)",}; // Assign DataSeries to RenderableSeries LineSeries.DataSeries = lineData; ScatterSeries.DataSeries = scatterData; int i = 0; // Start a timer to update our data var timer = new DispatcherTimer(DispatcherPriority.Render); timer.Interval = TimeSpan.FromMilliseconds(10); timer.Tick += (s, e) => { // This time we will append, not update. using (lineData.SuspendUpdates()) using (scatterData.SuspendUpdates()) { // Append a new data point; lineData.Append(i, Math.Sin(i * 0.1)); scatterData.Append(i, Math.Cos(i * 0.1)); // Set VisibleRange to last 1,000 points i++; } }; timer.Start(); } } } | |
Next: Adding the Annotations to the Chart
We are going to add a custom annotation to mark areas of interest on the chart. In this case we're going to borrow the NewsBulletAnnotation from the Trade Markers example. The code for the NewsBulletAnnotation is found below:
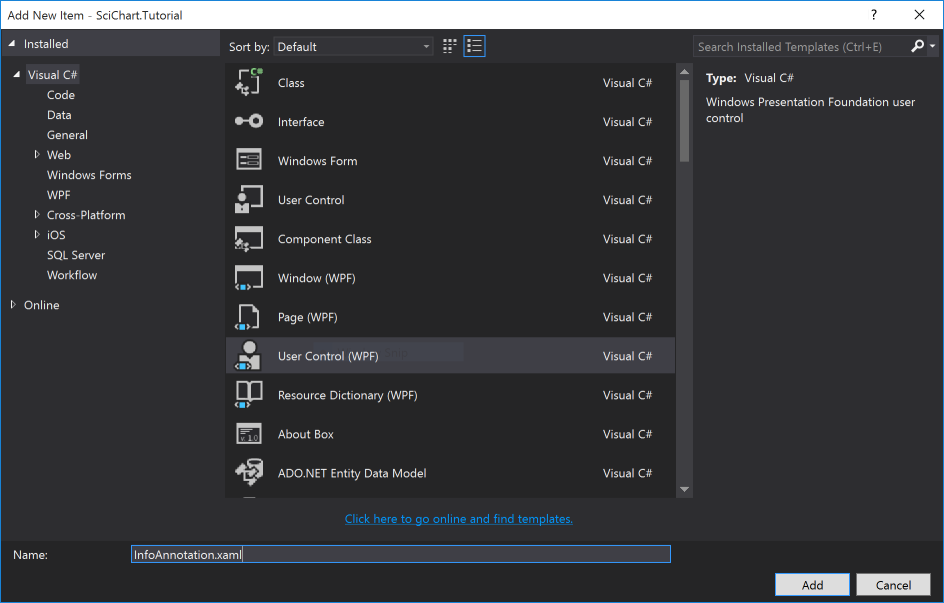
Add a new Item to the Project. Choose type UserControl and name it InfoAnnotation.xaml
Now paste the following code into the XAML and Code Behind:
| InfoAnnotation.Xaml |
Copy Code |
|---|---|
|
<s:CustomAnnotation x:Class="SciChart.Tutorial.InfoAnnotation" <s:CustomAnnotation.Resources> <Grid> <!-- Low-cost drop shadow --> <!-- News bullet body --> <!-- Creating the tooltip. In the TradeOverlayExampleViewModel we set a News </s:CustomAnnotation> | |
| InfoAnnotation.xaml.cs |
Copy Code |
|---|---|
using SciChart.Charting.Visuals.Annotations; namespace SciChart.Tutorial { public partial class InfoAnnotation : CustomAnnotation { public InfoAnnotation() { InitializeComponent(); } } } | |
Adding Annotations to the Chart
To add annotations to the chart, you simply need to add a new AnnotationBase derived class to SciChartSurface.Annotations collection and set X1, Y1 (optionally X2, Y2 for lines, boxes).
We're going to do this inside the DispatcherTimer.Tick event following on from our previous tutorial on Realtime Scrolling charts.
Modify the Timer.Tick event as follows:
| Adding Annotations in Realtime |
Copy Code |
|---|---|
timer.Tick += (s, e) =>
{
    // This time we will append, not update.
    using (lineData.SuspendUpdates())
    using (scatterData.SuspendUpdates())
    {
        // Append a new data point;
        lineData.Append(i, Math.Sin(i * 0.1));
        scatterData.Append(i, Math.Cos(i * 0.1));
        // Every 100th datapoint, add an annotation
        if (i%100 == 0)
        {
            sciChartSurface.Annotations.Add(new InfoAnnotation() { X1 = i, Y1 = 0.0});
            // Optional: Don't forget to remove annotations which are out of range!
            sciChartSurface.Annotations.RemoveWhere(x => x.X1.ToDouble() < i-1000);
        }
        i++;
    }

}; | |
That's it! If you run the application now, every 100 points you will see an Annotation added to the chart. We also remove annotations that are out of range to stop never-ending memory growth.
Further reading
- Read about the Annotations API here
- Read about the LineAnnotation type here
- Read about CustomAnnotations here
- See Annotation Examples in our Examples Suite