
Tutorial 08b - Adding Multiple Axis with MVVM
As well as series, and annotations, it is also possible to add multiple Axis to a SciChartSurface using our MVVM API.
Source code for this tutorial can be found at our SciChart.WPF.Examples Github Repository under Tutorials section.
It's quite simple to do this. We add some code in our View using the AxesBinding MarkupExtension to bind to collections in the viewmodel.
| MainWindow.xaml |
Copy Code |
|---|---|
<!-- Add a new line for XAxes and YAxes binding to collections in the ViewModel --> <s:SciChartSurface Grid.Row="1" RenderableSeries="{s:SeriesBinding RenderableSeries}" Annotations="{s:AnnotationsBinding Annotations}" YAxes="{s:AxesBinding YAxes}" XAxes="{s:AxesBinding XAxes}" ChartTitle="{Binding ChartTitle}"> <!-- Don't forget to remove the XAxis and YAxis we defined in XAML! --> <s:SciChartSurface.ChartModifier> <s:ModifierGroup> <s:RubberBandXyZoomModifier IsEnabled="{Binding EnableZoom}" /> <s:ZoomPanModifier IsEnabled="{Binding EnablePan}" ClipModeX="None" /> <s:ZoomExtentsModifier/> <s:LegendModifier ShowLegend="True" Orientation="Horizontal" VerticalAlignment="Top" HorizontalAlignment="Center"/> <s:RolloverModifier ShowTooltipOn="MouseHover"/> </s:ModifierGroup> </s:SciChartSurface.ChartModifier> | |
Now in the ViewModel we need collections for the YAxes and XAxes. We update our MainViewModel like this:
| MainViewModel |
Copy Code |
|---|---|
public class MainViewModel : BindableObject { private string _chartTitle = "Hello SciChart World!"; private string _xAxisTitle = "XAxis"; private string _yAxisTitle = "YAxis"; private ObservableCollection<IRenderableSeriesViewModel> _renderableSeries = new ObservableCollection<IRenderableSeriesViewModel>(); private bool _enablePan; private bool _enableZoom = true; private XyDataSeries<double, double> _lineData; private DummyDataProvider _dummyDataProvider = new DummyDataProvider(); private ObservableCollection<IAnnotationViewModel> _annotations = new ObservableCollection<IAnnotationViewModel>(); private ObservableCollection<IAxisViewModel> _yAxes = new ObservableCollection<IAxisViewModel>(); private ObservableCollection<IAxisViewModel> _xAxes = new ObservableCollection<IAxisViewModel>(); public MainViewModel() { CreateChartData(); CreateChartSeries(); CreateChartAxis(); // Subscribe to future updates int i = 0; _dummyDataProvider.SubscribeUpdates((newValues) => { // Append when new values arrive _lineData.Append(newValues.XValues, newValues.YValues); // Zoom the chart to fit _lineData.InvalidateParentSurface(RangeMode.ZoomToFit); // Every 100th datapoint, add an annotation if (i % 100 == 0) { Annotations.Add(new InfoAnnotationViewModel() { X1 = _lineData.XValues.Last(), Y1 = 0.0 }); } i++; }); } private void CreateChartAxis() { YAxes.Add(new NumericAxisViewModel() { AutoRange = AutoRange.Always, AxisTitle = "Left YAxis", Id = "LeftYAxis", AxisAlignment = AxisAlignment.Left, }); YAxes.Add(new NumericAxisViewModel() { AutoRange = AutoRange.Always, AxisTitle = "Right YAxis", AxisAlignment = AxisAlignment.Right, }); XAxes.Add(new NumericAxisViewModel() { AutoRange = AutoRange.Always, AxisTitle = "XAxis", AxisAlignment = AxisAlignment.Bottom, }); } public ObservableCollection<IAxisViewModel> YAxes { get { return _yAxes; } } public ObservableCollection<IAxisViewModel> XAxes { get { return _xAxes; } } ... code omitted for brevity ... } | |
When you run your application you should see something like this:
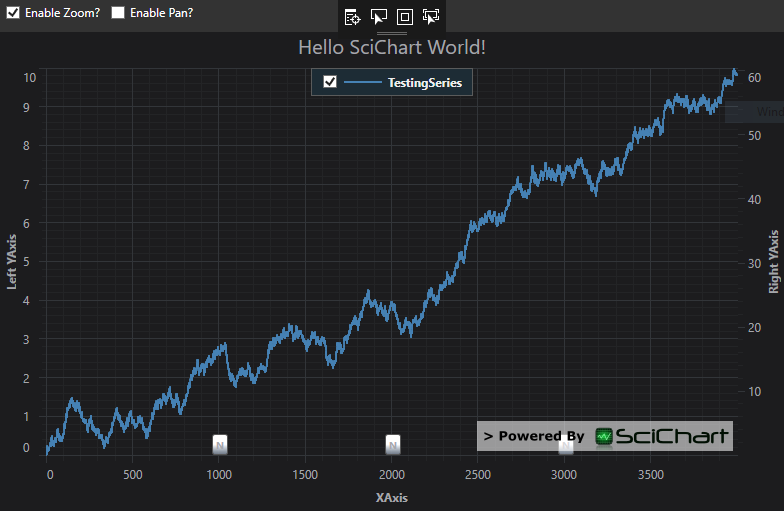
Registering Series, Annotations on different axis
By default, all series and annotations are registered onto the axis with Axis.ID='DefaultAxisId'. If you wish to change this, set the YAxisId/XAxisId on the RenderableSeries, or Annotation equal to the axis ID you want it registered on.
For more info, see the Multiple Axis documentation.