
In our series of tutorials, up until now we have added a chart with two YAxis, one XAxis, two series, added tooltips, legends and zooming, panning behavior, and added some annotations.
Next, we are going to show you how to create multiple charts and link them together.
Revision
If you haven't already you will need to review the following tutorials, as we're working straight from these:
Or, if you're in a hurry, skim through the tutorials and copy paste the code into a new solution. Once you've done that, we are ready to get started.
Your XAML code Before the tutorial starts should look like this:
| XAML Code BEFORE tutorial starts |
Copy Code |
|---|---|
<Window x:Class="SciChart.Tutorial.MainWindow" xmlns="http://schemas.microsoft.com/winfx/2006/xaml/presentation" xmlns:x="http://schemas.microsoft.com/winfx/2006/xaml" xmlns:d="http://schemas.microsoft.com/expression/blend/2008" xmlns:mc="http://schemas.openxmlformats.org/markup-compatibility/2006" xmlns:s="http://schemas.abtsoftware.co.uk/scichart" mc:Ignorable="d" Title="MainWindow" Height="550" Width="800"> <Grid Background="#222"> <Grid.RowDefinitions> <RowDefinition Height="*"/> <RowDefinition Height="Auto"/> </Grid.RowDefinitions> <s:SciChartSurface x:Name="sciChartSurface"> <s:SciChartSurface.RenderableSeries> <s:FastLineRenderableSeries x:Name="LineSeries" Stroke="#FF4083B7"/> <s:XyScatterRenderableSeries x:Name="ScatterSeries" YAxisId="Axis2"> <s:XyScatterRenderableSeries.PointMarker> <s:EllipsePointMarker Width="7" Height="7" Fill="#FFF" Stroke="SteelBlue"/> </s:XyScatterRenderableSeries.PointMarker> </s:XyScatterRenderableSeries> </s:SciChartSurface.RenderableSeries> <s:SciChartSurface.XAxis> <s:NumericAxis AxisTitle="Number of Samples (per Series)"/> </s:SciChartSurface.XAxis> <s:SciChartSurface.YAxes> <s:NumericAxis AxisTitle="Value" GrowBy="0.1,0.1" VisibleRange="-1.1, 1.1"/> <s:NumericAxis Id="Axis2" AxisTitle="Secondary" GrowBy="0.1,0.1" VisibleRange="-2.0, 2.0" AxisAlignment="Left"/> </s:SciChartSurface.YAxes> <s:SciChartSurface.ChartModifier> <s:ModifierGroup> <s:RubberBandXyZoomModifier ExecuteOn="MouseLeftButton" RubberBandFill="#33FFFFFF" RubberBandStroke="#AAFFFFFF" RubberBandStrokeDashArray="2 2"/> <s:ZoomPanModifier ExecuteOn="MouseRightButton" ClipModeX="None" /> <s:YAxisDragModifier DragMode="SinWindow.xaml.cs BEFORE the Tutorial Startscale"/> <s:XAxisDragModifier DragMode="Pan"/> <s:MouseWheelZoomModifier/> <s:ZoomExtentsModifier ExecuteOn="MouseDoubleClick" /> <s:LegendModifier ShowLegend="True" Orientation="Horizontal" VerticalAlignment="Bottom" HorizontalAlignment="Center" LegendPlacement="Inside" /> <s:RolloverModifier ExecuteOn="MouseMove" ShowTooltipOn="MouseHover"/> </s:ModifierGroup> </s:SciChartSurface.ChartModifier> <s:SciChartSurface.Annotations> <s:TextAnnotation Text="Hello world!" X1="5.0" Y1="5"/> </s:SciChartSurface.Annotations> </s:SciChartSurface> <s:SciChartScrollbar Grid.Row="1" Axis="{Binding ElementName=sciChartSurface, Path=XAxis}"/> </Grid> </Window> | |
| Mainwindow.xaml.cs BEFORE tutorial starts |
Copy Code |
|---|---|
using System; using System.Windows; using System.Windows.Threading; using SciChart.Charting.Model.DataSeries; using SciChart.Charting.Visuals.Axes; using SciChart.Core.Extensions; using SciChart.Data.Model; namespace SciChart.Tutorial { public partial class MainWindow : Window { public MainWindow() { InitializeComponent(); this.Loaded += OnLoaded; } private void OnLoaded(object sender, RoutedEventArgs routedEventArgs) { double windowSize = 1000.0; sciChartSurface.ViewportManager = new ScrollingViewportManager(windowSize); // Create DataSeries with FifoCapacity var scatterData = new XyDataSeries<double, double>() {SeriesName = "Cos(x)",}; var lineData = new XyDataSeries<double, double>() {SeriesName = "Sin(x)",}; // Assign DataSeries to RenderableSeries LineSeries.DataSeries = lineData; ScatterSeries.DataSeries = scatterData; int i = 0; // Start a timer to update our data var timer = new DispatcherTimer(DispatcherPriority.Render); timer.Interval = TimeSpan.FromMilliseconds(10); timer.Tick += (s, e) => { // This time we will append, not update. using (lineData.SuspendUpdates()) using (scatterData.SuspendUpdates()) { // Append a new data point; lineData.Append(i, Math.Sin(i * 0.1)); scatterData.Append(i, Math.Cos(i * 0.1)); // Every 100th datapoint, add an annotation if (i % 100 == 0) { sciChartSurface.Annotations.Add(new InfoAnnotation() { X1 = i, Y1 = 0.0, YAxisId = i % 200 == 0 ? AxisBase.DefaultAxisId : "Axis2" }); // Optional: Don't forget to remove annotations which are out of range! sciChartSurface.Annotations.RemoveWhere(x => x.X1.ToDouble() < i - 1000); } i++; } }; timer.Start(); } } } | |
Adding a Second SciChartSurface
There is no restriction on the number of SciChartSurfaces you can have in an application. In this tutorial we are going to add a second SciChartSurface.
Let's start by adding a second SciChartSurface to the XAML:
| Adding a second SciChartSurface |
Copy Code |
|---|---|
<Window x:Class="SciChart.Tutorial.MainWindow" xmlns="http://schemas.microsoft.com/winfx/2006/xaml/presentation" xmlns:x="http://schemas.microsoft.com/winfx/2006/xaml" xmlns:d="http://schemas.microsoft.com/expression/blend/2008" xmlns:mc="http://schemas.openxmlformats.org/markup-compatibility/2006" xmlns:s="http://schemas.abtsoftware.co.uk/scichart" mc:Ignorable="d" Title="MainWindow" Height="550" Width="800"> <Grid> <Grid.RowDefinitions> <RowDefinition Height="*"/> <!-- NEW CODE HERE --> <RowDefinition Height="*"/> <!-- END NEW CODE --> <RowDefinition Height="32"/> </Grid.RowDefinitions> <s:SciChartSurface x:Name="sciChartSurface"> <!-- This is the first SciChartSurface you previously added --> <!-- Omitted for brevity --> </s:SciChartSurface> <!-- NEW CODE HERE --> <!-- This is the second SciChartSurface we will add --> <s:SciChartSurface x:Name="sciChartSurface1" Grid.Row="1"> <s:SciChartSurface.XAxis> <s:NumericAxis AxisTitle="Number of Samples (per Series)"/> </s:SciChartSurface.XAxis> <s:SciChartSurface.YAxes> <s:NumericAxis AxisTitle="Value" GrowBy="0.1,0.1" VisibleRange="-1.1, 1.1"/> <s:NumericAxis Id="Axis2" AxisTitle="Secondary" GrowBy="0.1,0.1" VisibleRange="-2.0, 2.0" AxisAlignment="Left"/> </s:SciChartSurface.YAxes> </s:SciChartSurface> <!-- END NEW CODE --> <!-- DON'T FORGET TO CHANGE GRID.ROW TO 2 HERE --> <s:SciChartScrollbar Grid.Row="2" Axis="{Binding ElementName=sciChartSurface, Path=XAxis}"/> </Grid> </Window> | |
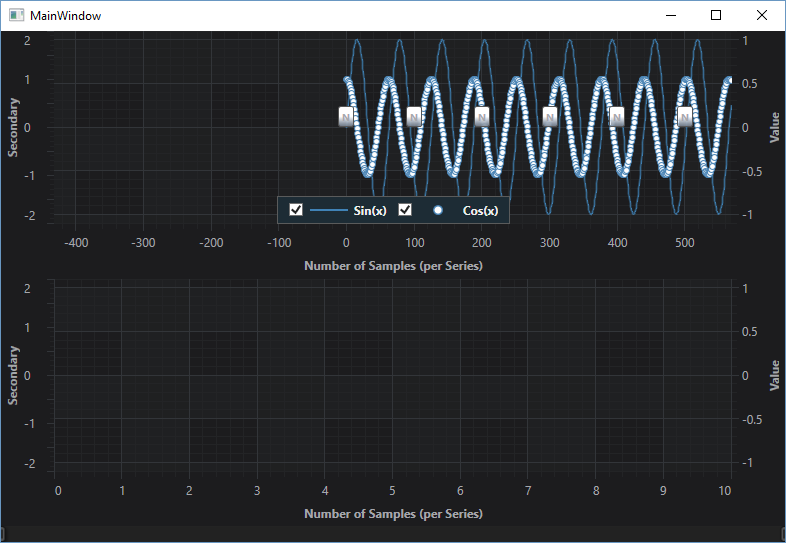
If you run the application at this point, you will see our first Realtime chart is displayed at the top of the application, and the second chart 'sciChartSurface1' is static, and displayed underneath.
Adding Series to the Second Chart
The second chart needs a series, so we are going to add a Mountain Series. Add the following series to the chart in XAML:
| Adding a Series to second chart |
Copy Code |
|---|---|
<s:SciChartSurface x:Name="sciChartSurface1" Grid.Row="1"> <s:SciChartSurface.RenderableSeries> <s:FastMountainRenderableSeries x:Name="mountainSeries" Stroke="LightSteelBlue" Fill="SteelBlue" Opacity="0.6" StrokeThickness="2"/> </s:SciChartSurface.RenderableSeries> ... </s:SciChartSurface> | |
Now, in code behind, this series needs some data. We're going to be lazy and assign some of the same data to the mountainSeries (you can do that!).
| Code Behind - assign data to series |
Copy Code |
|---|---|
private void OnLoaded(object sender, RoutedEventArgs routedEventArgs) { double windowSize = 1000.0; sciChartSurface.ViewportManager = new ScrollingViewportManager(windowSize); // Create DataSeries with FifoCapacity var scatterData = new XyDataSeries<double, double>() {SeriesName = "Cos(x)",}; var lineData = new XyDataSeries<double, double>() {SeriesName = "Sin(x)",}; // Assign DataSeries to RenderableSeries LineSeries.DataSeries = lineData; ScatterSeries.DataSeries = scatterData; mountainSeries.DataSeries = scatterData; // <-- NEW CODE HERE! | |
Now run the application. It doesn't look right does it? The top chart is scrolling but the bottom chart is not scrolling.
There is a trick to linking the two charts and it is binding the VisibleRanges of the two XAxis together. We are going to do this below.
In the second chart, add this line to bind XAxis.VisibleRange to the first chart. Make sure it is a TwoWay binding
| Binding XAxis VisibleRange |
Copy Code |
|---|---|
<s:SciChartSurface x:Name="sciChartSurface1" Grid.Row="1"> ... <s:SciChartSurface.XAxis> <s:NumericAxis AxisTitle="Number of Samples (per Series)" VisibleRange="{Binding ElementName=sciChartSurface, Path=XAxis.VisibleRange, Mode=TwoWay}"/> </s:SciChartSurface.XAxis> ... </s:SciChartSurface> | |
Now run the example again.
That's better!
Linking Cursor and Mouse Events
The next thing we are going to do is to link mouse and cursor events. The first chart has an array of ChartModifiers set up to handle zooming, panning and tooltips. We are going to add some of these modifiers to the second chart.
Add the following XAML to the second chart to add the zoom, pan and tooltip modifiers.
| ChartModifiers in the second chart |
Copy Code |
|---|---|
<s:SciChartSurface x:Name="sciChartSurface1" Grid.Row="1"> ... <s:SciChartSurface.ChartModifier> <s:ModifierGroup> <s:RubberBandXyZoomModifier ExecuteOn="MouseLeftButton" RubberBandFill="#33FFFFFF" RubberBandStroke="#AAFFFFFF" RubberBandStrokeDashArray="2 2"/> <s:ZoomPanModifier ExecuteOn="MouseRightButton" ClipModeX="None" /> <s:YAxisDragModifier DragMode="Scale"/> <s:XAxisDragModifier DragMode="Pan"/> <s:MouseWheelZoomModifier/> <s:ZoomExtentsModifier ExecuteOn="MouseDoubleClick" /> <s:RolloverModifier ExecuteOn="MouseMove" ShowTooltipOn="Always"/> </s:ModifierGroup> </s:SciChartSurface.ChartModifier> </s:SciChartSurface> | |
If you run the applicaiton now, you will notice that you have zooming behaviour and tooltips on both charts, but the mouse events still aren't quite linked. You need to do a few more steps to fully link the charts together.
Using MouseManager.MouseEventGroup
We need to use the MouseManager.MouseEventGroup attached property on the ModifierGroups on both charts. Set this to a string value. It needs to be the same string on both charts to link the charts together.
| Using MouseEventGroup |
Copy Code |
|---|---|
<!-- Add a MouseEventGroup to Both charts --> <s:ModifierGroup s:MouseManager.MouseEventGroup="MyMouseGroup"> </s:ModifierGroup> | |
Run the application again. Move the mouse over the chart. The Cursors and Tooltips are now synchronizing across the charts.
You can also zoom, pan (and remember from Tutorial 06 - Adding Realtime Updates, you need to double click to re-enable scrolling after zooming or panning).
Further Reading