
What is a Ternary Chart?
NOTE: The Ternary Chart feature requires version v4.1 of SciChart or higher
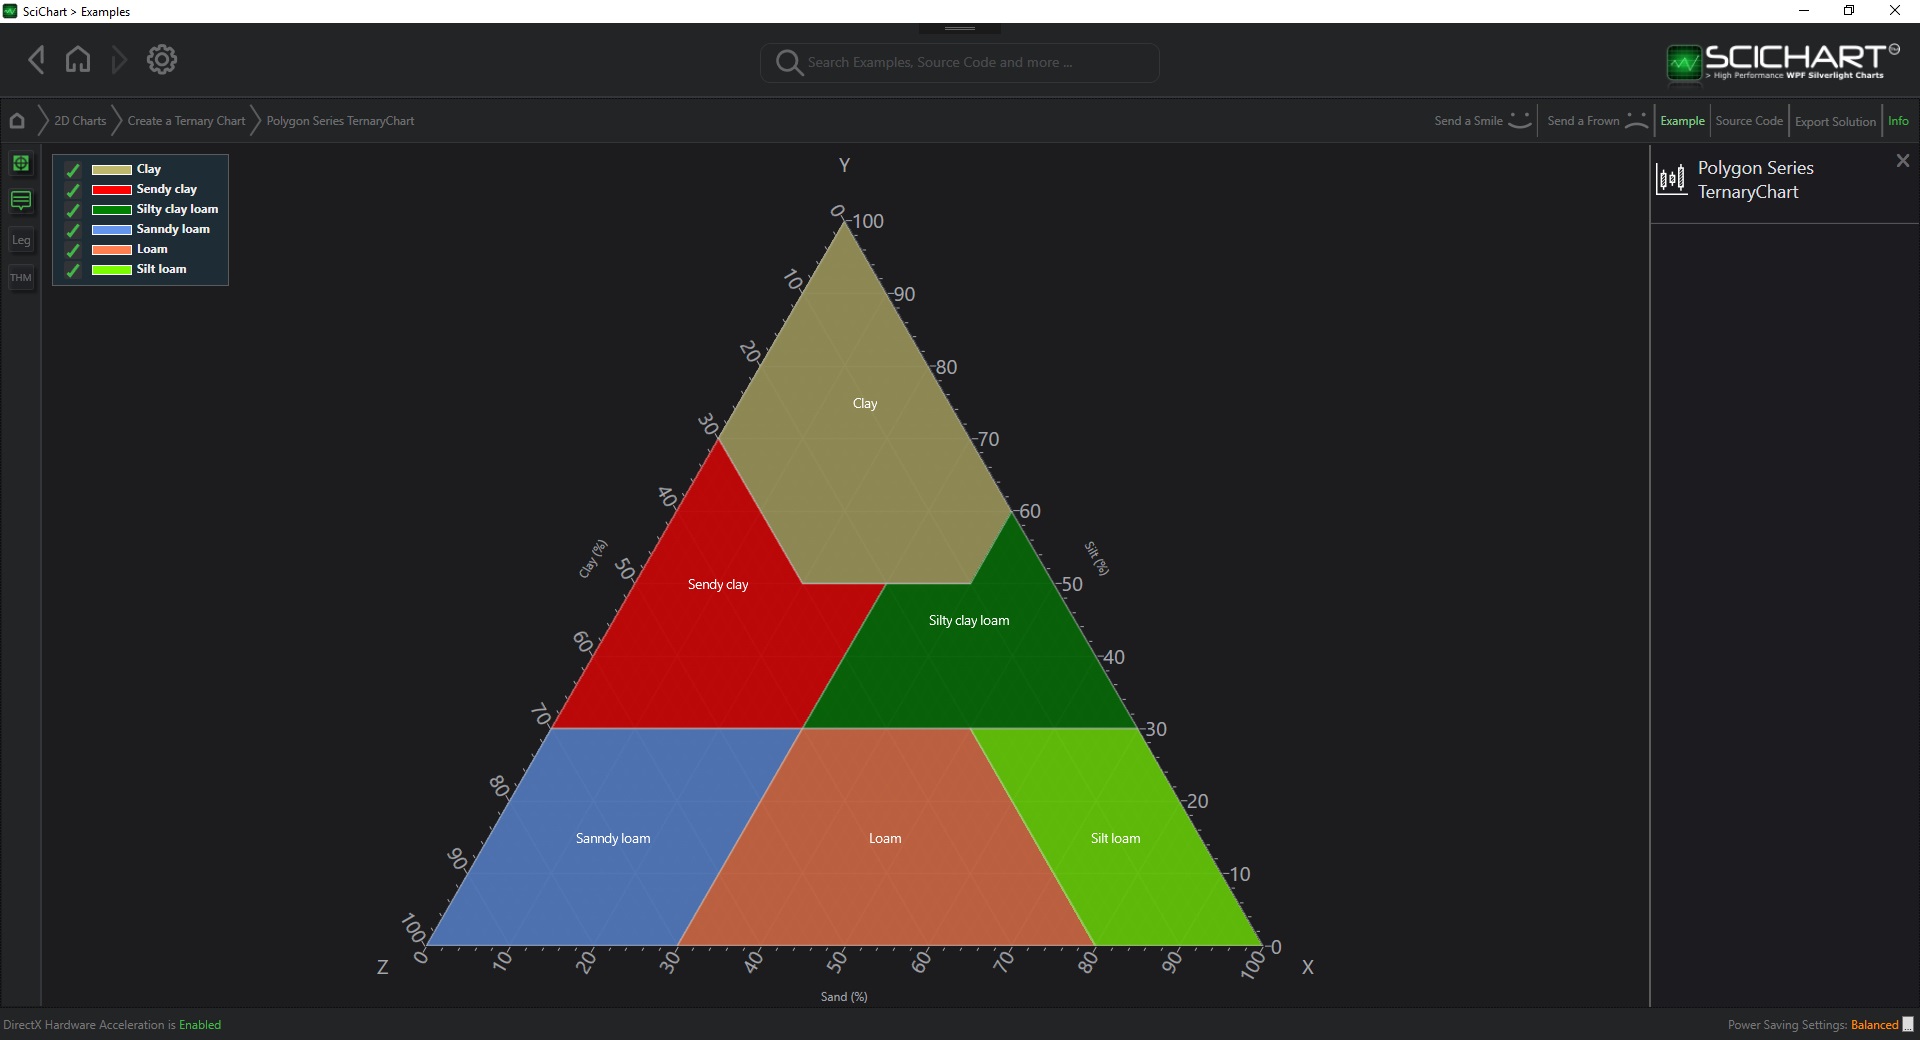
Ternary Chart is a barycentric plot on three variables which sum to a constant. It graphically depicts the ratios of the three variables as positions in an equilateral triangle. It is used in physical chemistry, petrology, mineralogy, metallurgy, and other physical sciences to show the compositions of systems composed of three species. In population genetics, it is often called a Gibbs triangle or a de Finetti diagram. In game theory, it is often called a simplex plot.
See Also