SciChart WPF 3D Charts > ChartModifier3D API > Zooming and Panning > The ZoomExtentsModifier3D
The ZoomExtentsModifier3D

Zooming and Panning a Chart in SciChart3D is achieved by moving the SciChart3DSurface.Camera to a new location.

The article "The SciChart3DSurface Camera" goes into detail how this camera class works and how to manipulate it programatically to achieve various views.

If you get lost and want to quickly zoom to fit the 3D Chart to the available space, you can use the ZoomExtentsModifier3D.

With this modifier enabled: Double click or double-tap on the chart to zoom to fit.  
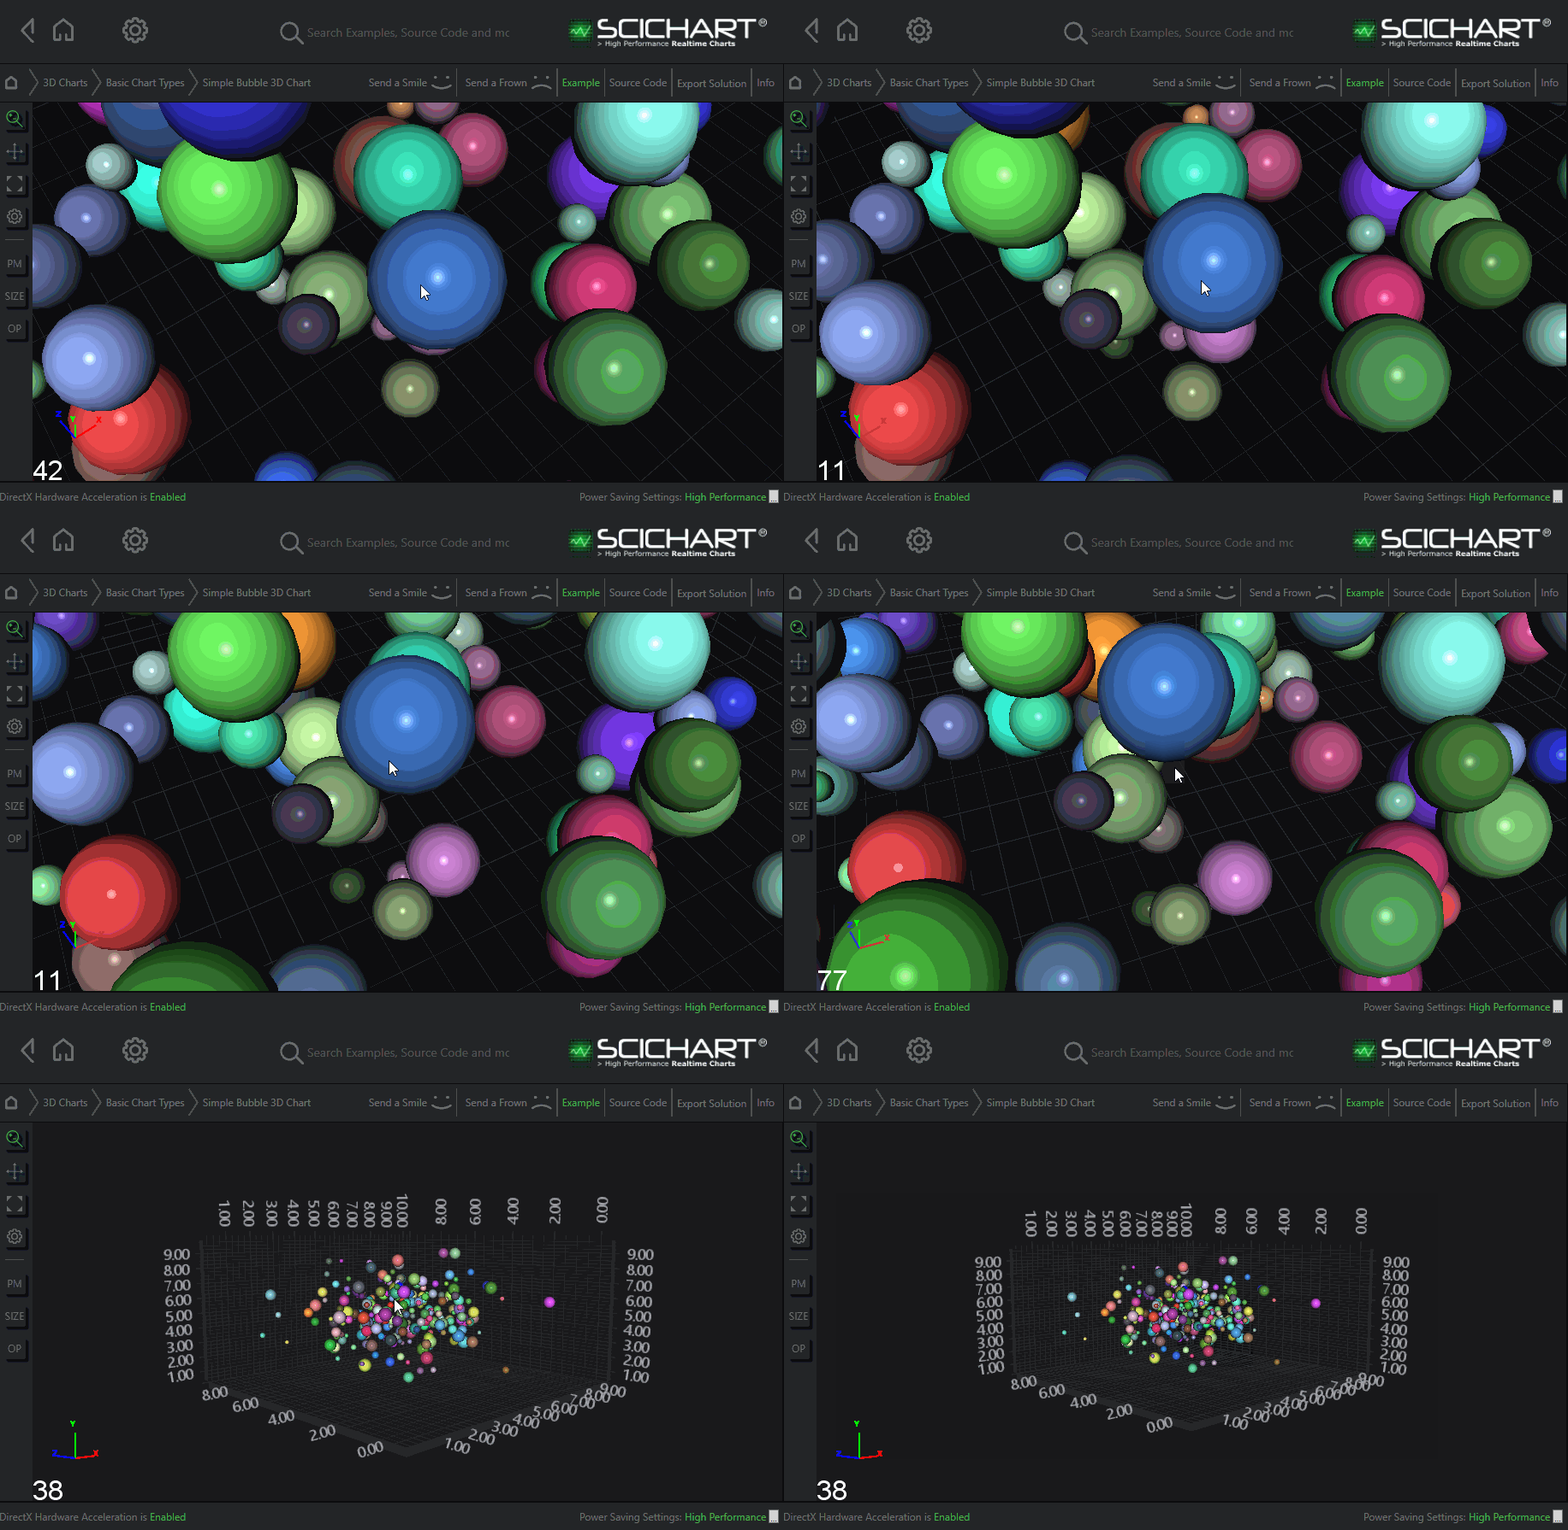


How does it work?

There are two modes of operation for the ZoomExtentsModifier3D.

  1. Attempt to AutoFit the 3D scene into the viewport by setting ZoomExtentsModifier3D.AutoFitRadius = true.
  2. You specify precise coordinates for the Camera.Target and Position when ZoomExtentsModifier3D.AutoFitRadius = false.


Declaring a ZoomExtentsModifier3D in XAML

Declaring a ZoomExtentsModifier3D is as simple as adding one to the SciChart3DSurface.ChartModifier property. This can be done as a single modifier, or as part of a ModifierGroup3D.

The following code will reset the camera position to 200,200,200 and target to 0,0,0 on double click of the mouse.


<s3D:SciChart3DSurface x:Name="scs" >
   
    <!-- XAxis, YAxis, RenderableSeries omitted for brevity -->       
   
    <s3D:SciChart3DSurface.ChartModifier>
        <s3D:ModifierGroup3D>
            <!-- Add the ZoomExtentsModifier3D to the chart. Optional. add other modifiers -->
            <s3D:ZoomExtentsModifier3D AnimateDurationMs="500"
                                       AutoFitRadius="False"
                                       ExecuteOn="MouseDoubleClick" 
                                       ResetPosition="200,200,200"
                                       ResetTarget="0,0,0"/>           
        </s3D:ModifierGroup3D>
    </s3D:SciChart3DSurface.ChartModifier>
   
</s3D:SciChart3DSurface>
var sciChart3DSurface = new SciChart3DSurface();
// XAxis, YAxis, RenderableSeries omitted for brevity
var modifierGroup = new ModifierGroup3D();
modifierGroup.ChildModifiers.Add(new ZoomExtentsModifier3D () {
    IsEnabled = true,
    AutoFitRadius = false, 
    ExecuteOn = ExecuteOn.MouseDoubleClick,
    ResetPosition = new Vector3(200,200,200),
    ResetTarget = new Vector3(0,0,0),
});
sciChart3DSurface.ChartModifier = modifierGroup;