The Column Series Type
Column Chart is provided by the FastColumnRenderableSeries class. It accepts data (X, Y) from a XyDataSeries<TX,TY> and renders a column at each [X, Y] value.
Note
Examples for the Column Series can be found in the SciChart Android Examples Suite as well as on GitHub:
The FastColumnRenderableSeries class allows to specify Fill brush, Stroke pen and relative DataPointWidth which will be applied to every column. You can also choose the TextureMappingMode for Fill brush which defines how columns are filled when a gradient is used. The DataPointWidth specifies how much space a single column occupies, varying from 0 to 1 (when columns are conjoined).
Note
To learn more about Pens and Brushes and how to utilize them, please refer to the PenStyle, BrushStyle and FontStyle article.
Also, it is possible to define the ZeroLineY baseline position via the zeroLineY property. All data points that have Y value less than ZeroLineY will appear downward, else - upward.
All those values can be assigned via the corresponding properties:
Note
In multi axis scenarios, a series has to be assigned to particular X and Y axes. This can be done passing the axes IDs to the xAxisId, yAxisId properties.
Create a Column Series
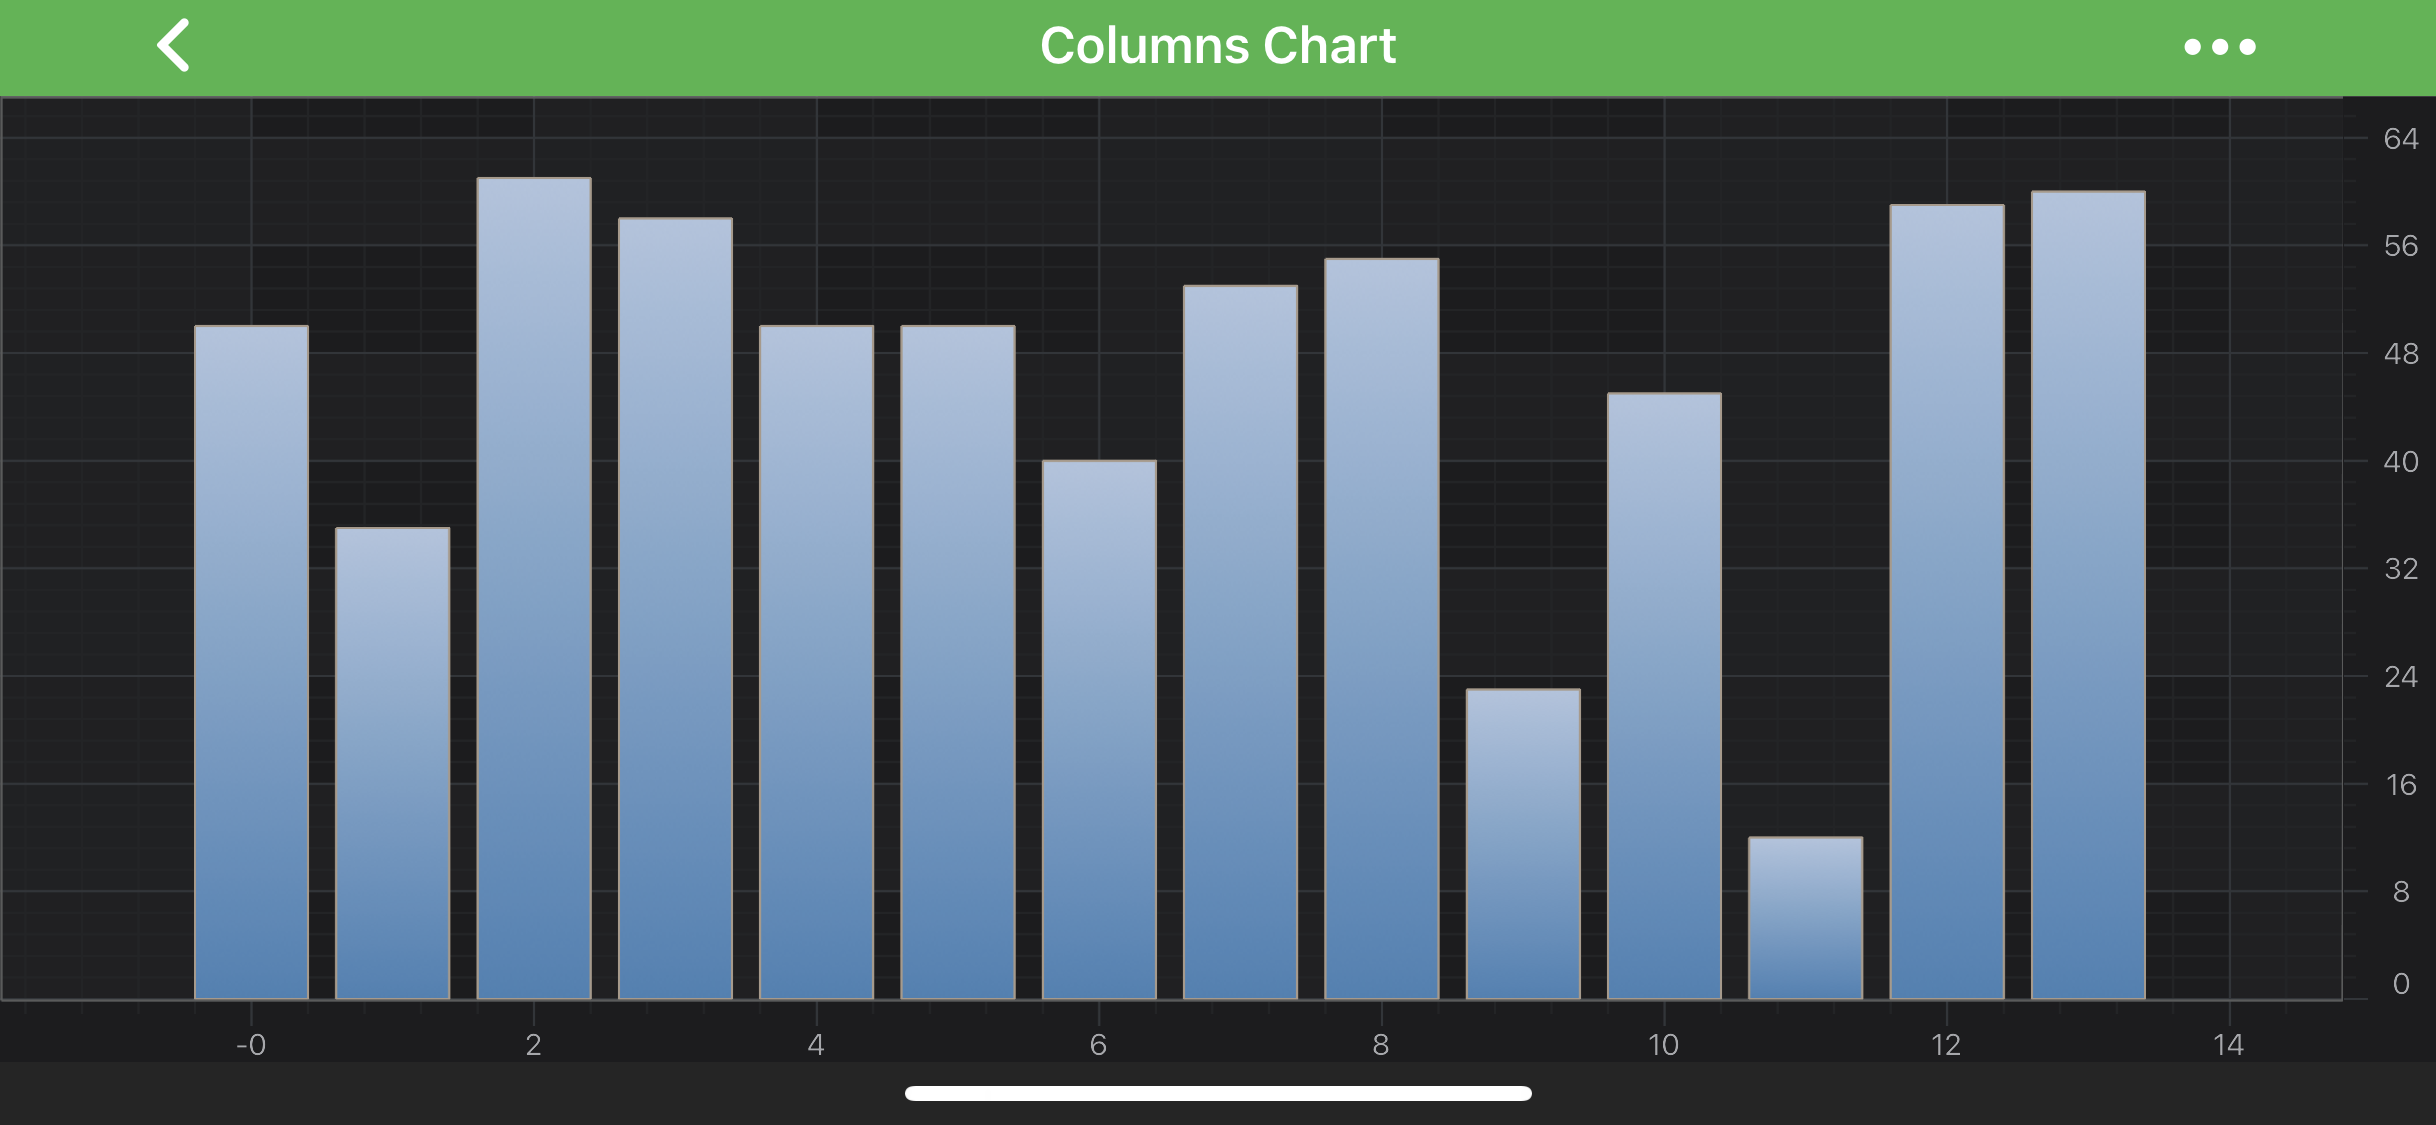
To create a Column Series, use the following code:
@Override
protected void initExample(@NonNull SciChartSurface surface) {
    final IXyDataSeries<Double, Double> dataSeries = new XyDataSeries<>(Double.class, Double.class);
    dataSeries.append(0.0, -3.0);
    dataSeries.append(1.0, 1.0);
    dataSeries.append(2.0, 4.0);

    final FastColumnRenderableSeries columnSeries = new FastColumnRenderableSeries();

    columnSeries.setDataSeries(dataSeries);
    columnSeries.setFillBrushStyle(new SolidBrushStyle(Color.CYAN));
    columnSeries.setStrokeStyle(new SolidPenStyle(Color.RED, true, 1f, null));

    UpdateSuspender.using(surface, () -> {
        Collections.addAll(surface.getXAxes(), new NumericAxis(requireContext()));
        Collections.addAll(surface.getYAxes(), new NumericAxis(requireContext()));

        Collections.addAll(surface.getRenderableSeries(), columnSeries);
    });
}
Column Series Features
Column Series also has some features similar to other series, such as:
Render a Gap in a Column Series
It's possible to render a Gap in Column series, by passing a data point with a NaN as the Y value. Please refer to the RenderableSeries APIs article for more details.
Paint Column Area Parts With Different Colors
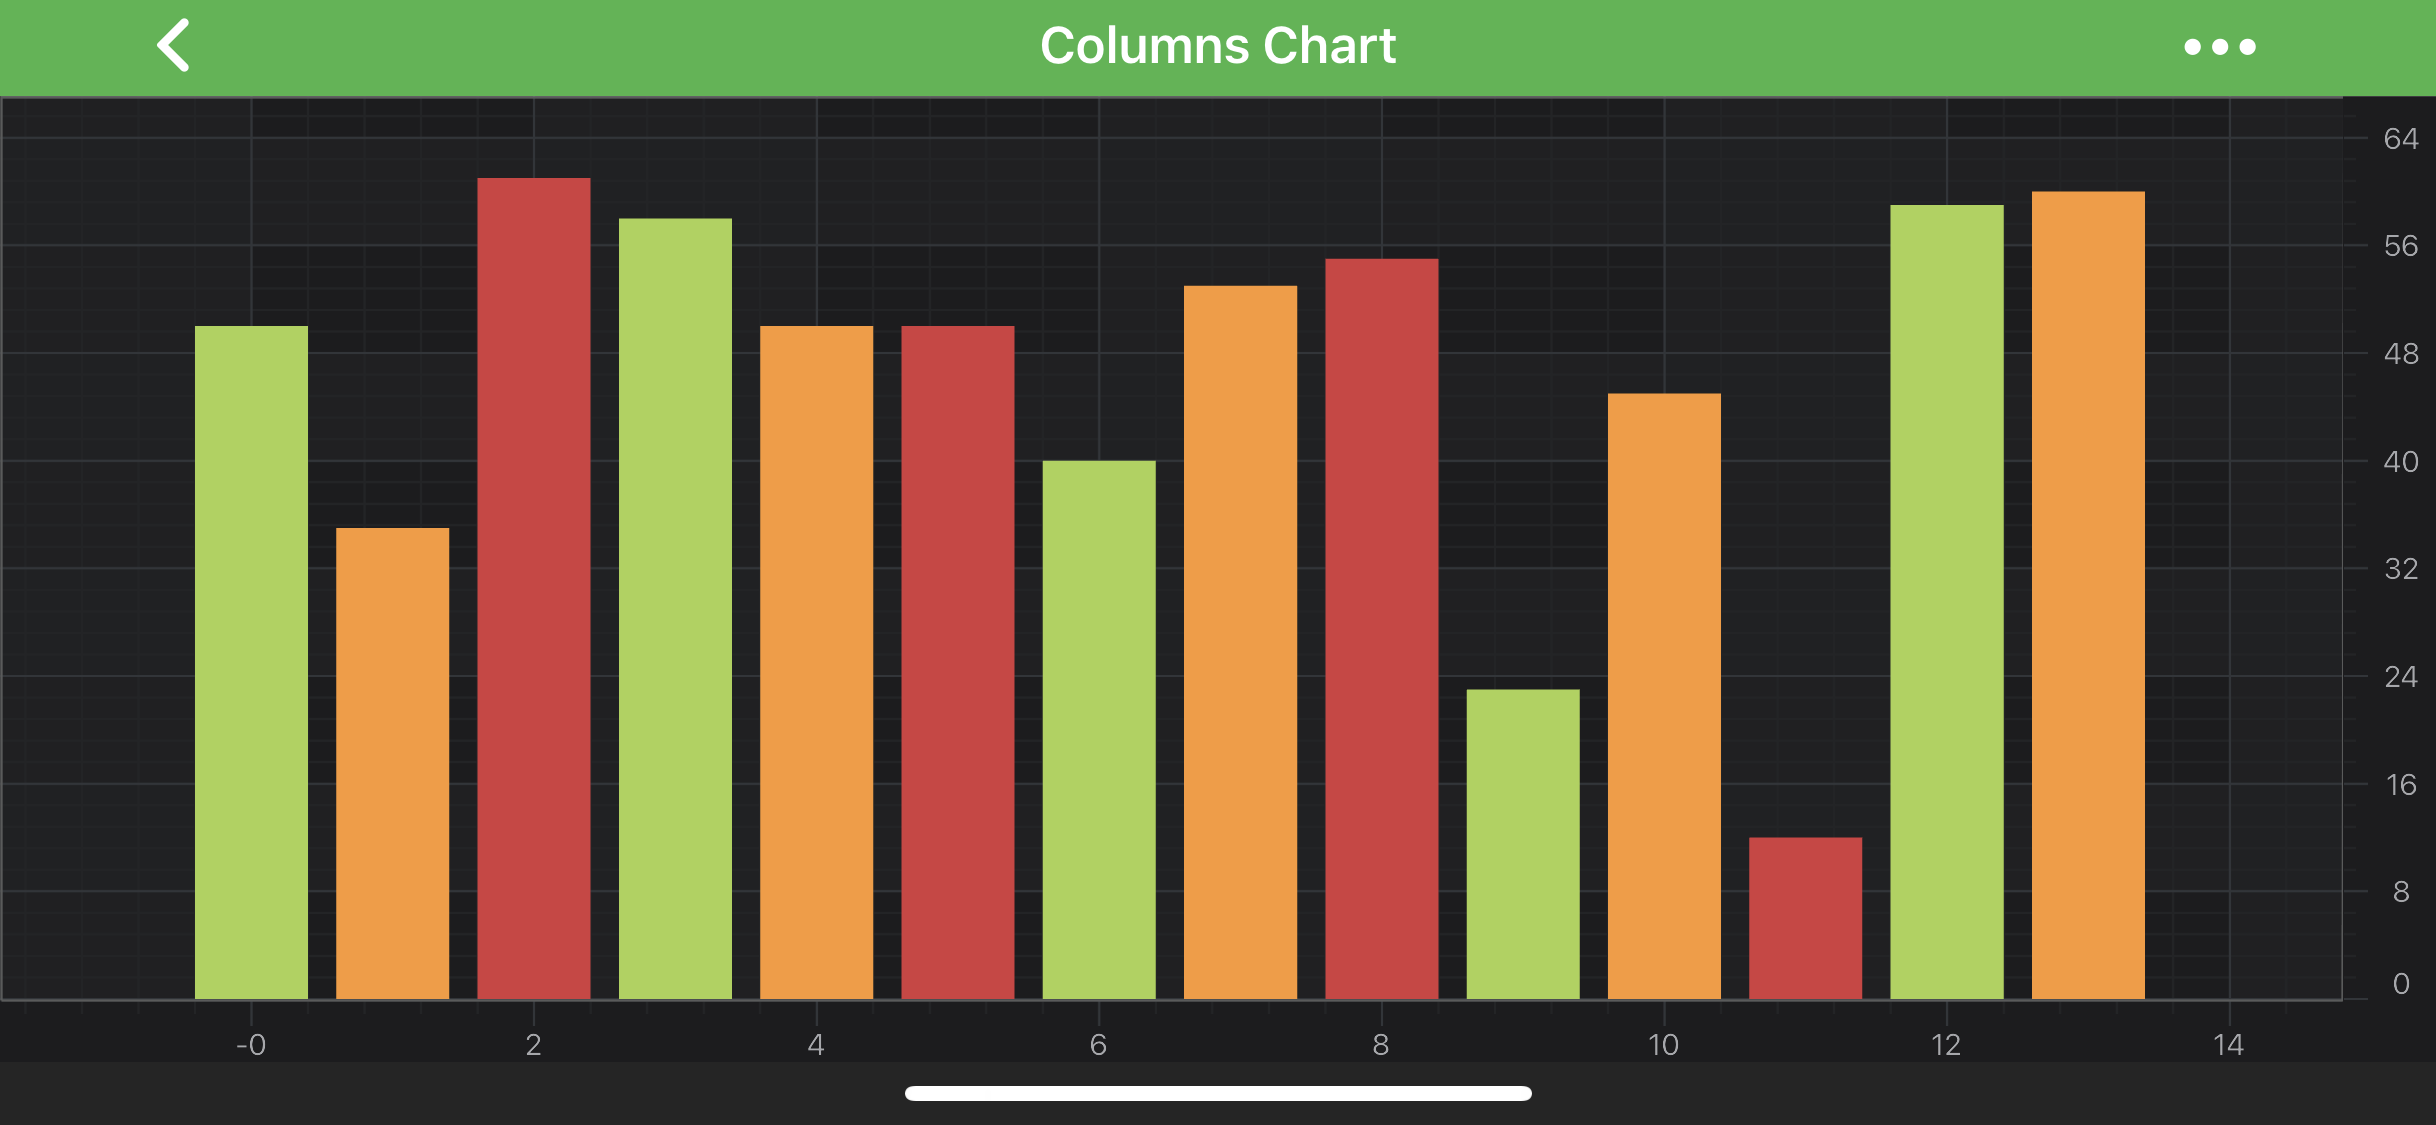
In SciChart, you can draw each column of the Column Series with different colors using the PaletteProvider API. To use palette provider for Columns - a custom IFillPaletteProvider (or IStrokePaletteProvider) has to be provided to the paletteProvider property.
Please see the code snippet from our Column Chart Example. For more information - please refer to the PaletteProvider API article.