Search Results for

    Show / Hide Table of Contents

    PaletteProvider API

    SciChart features a rich PaletteProvider API with gives the ability to change color on a point-by-point basis.

    PaletteProvider API

    Note

    Examples of using PaletteProvider API can be found in the SciChart Android Examples Suite as well as on GitHub:

    • Native Example

    To enable series coloring with PaletteProvider, you need to create a class which conforms to one of the following (or possibly to all of them):

    • IStrokePaletteProvider - allows painting parts of the series' outline;
    • IFillPaletteProvider - allows painting some area in a color that differs from the rest of a series;
    • IPointMarkerPaletteProvider - allows changing the fill of some PointMarkers.

    A choice depends on a RenderableSeries type, which PaletteProvider is designed for.

    Every PaletteProvider protocol declares the only property, which returns an array with colors for every data points. The update() method is called every time a RenderableSeries requires a redraw, so it expects that the colors array should be updated there correspondingly.

    For the convenience, there is also the PaletteProviderBase<T> class, which provides some basic implementation, so it's recommended to inherit from it while implementing custom PaletteProviders.

    Create Custom PaletteProvider

    The following code snippet demonstrates how to create a custom PaletteProvider which conforms to all - Fill, Stroke, PointMarker - palette providers and potentially can be shared between multiple series.

    Note

    The below code is based on the Line Chart Example which can be found in the SciChart Android Examples Suite as well as on GitHub:

    • Native Example
    • Xamarin Example
    • Java
    • Java with Builders API
    • Kotlin
    final class SharedPaletteProvider extends PaletteProviderBase<XyRenderableSeriesBase> implements IFillPaletteProvider, IStrokePaletteProvider, IPointMarkerPaletteProvider {
        private final IntegerValues strokeColors = new IntegerValues();
        private final IntegerValues fillColors = new IntegerValues();
    
        private IAnnotation lowerLimit;
        private IAnnotation upperLimit;
    
        public SharedPaletteProvider(IAnnotation lowerLimit, IAnnotation upperLimit) {
            super(XyRenderableSeriesBase.class);
    
            this.lowerLimit = lowerLimit;
            this.upperLimit = upperLimit;
        }
    
        @Override
        public void update() {
            final double y1 = (Double) lowerLimit.getY1();
            final double y2 = (Double) upperLimit.getY2();
    
            final double minimum = Math.min(y1, y2);
            final double maximum = Math.max(y1, y2);
    
            final XyRenderPassData renderPassData = (XyRenderPassData) renderableSeries.getCurrentRenderPassData();
            final int size = renderPassData.pointsCount();
            strokeColors.setSize(size);
            fillColors.setSize(size);
    
            DoubleValues yValues = renderPassData.yValues;
            for (int i = 0; i < size; i++) {
                final double value = yValues.get(i);
                if (value > maximum) {
                    strokeColors.set(i, 0xffff0000);
                    fillColors.set(i, 0xffff0000);
                } else if (value < minimum) {
                    strokeColors.set(i, 0xff00ff00);
                    fillColors.set(i, 0x9900ff00);
                } else {
                    strokeColors.set(i, 0xffffff00);
                    fillColors.set(i, 0x99ffff00);
                }
            }
        }
    
        @Override
        public IntegerValues getStrokeColors() {
            return strokeColors;
        }
    
        @Override
        public IntegerValues getFillColors() {
            return fillColors;
        }
    
        @Override
        public IntegerValues getPointMarkerColors() {
            return fillColors;
        }
    
    }
    
    final class SharedPaletteProvider extends PaletteProviderBase<XyRenderableSeriesBase> implements IFillPaletteProvider, IStrokePaletteProvider, IPointMarkerPaletteProvider {
        private final IntegerValues strokeColors = new IntegerValues();
        private final IntegerValues fillColors = new IntegerValues();
    
        private IAnnotation lowerLimit;
        private IAnnotation upperLimit;
    
        public SharedPaletteProvider(IAnnotation lowerLimit, IAnnotation upperLimit) {
            super(XyRenderableSeriesBase.class);
    
            this.lowerLimit = lowerLimit;
            this.upperLimit = upperLimit;
        }
    
        @Override
        public void update() {
            final double y1 = (Double) lowerLimit.getY1();
            final double y2 = (Double) upperLimit.getY2();
    
            final double minimum = Math.min(y1, y2);
            final double maximum = Math.max(y1, y2);
    
            final XyRenderPassData renderPassData = (XyRenderPassData) renderableSeries.getCurrentRenderPassData();
            final int size = renderPassData.pointsCount();
            strokeColors.setSize(size);
            fillColors.setSize(size);
    
            DoubleValues yValues = renderPassData.yValues;
            for (int i = 0; i < size; i++) {
                final double value = yValues.get(i);
                if (value > maximum) {
                    strokeColors.set(i, 0xffff0000);
                    fillColors.set(i, 0xffff0000);
                } else if (value < minimum) {
                    strokeColors.set(i, 0xff00ff00);
                    fillColors.set(i, 0x9900ff00);
                } else {
                    strokeColors.set(i, 0xffffff00);
                    fillColors.set(i, 0x99ffff00);
                }
            }
        }
    
        @Override
        public IntegerValues getStrokeColors() { return strokeColors; }
    
        @Override
        public IntegerValues getFillColors() { return fillColors; }
    
        @Override
        public IntegerValues getPointMarkerColors() { return fillColors; }
    
    }
    
    class SharedPaletteProvider(private val lowerLimit: IAnnotation, private val upperLimit: IAnnotation) : PaletteProviderBase<XyRenderableSeriesBase>(XyRenderableSeriesBase::class.java), IFillPaletteProvider, IStrokePaletteProvider, IPointMarkerPaletteProvider {
        private val strokeColors = IntegerValues()
        private val fillColors = IntegerValues()
    
        override fun update() {
            val y1 = lowerLimit.y1 as Double
            val y2 = upperLimit.y2 as Double
    
            val minimum = Math.min(y1, y2)
            val maximum = Math.max(y1, y2)
    
            val renderPassData = renderableSeries!!.currentRenderPassData as XyRenderPassData
            val size = renderPassData.pointsCount()
            strokeColors.setSize(size)
            fillColors.setSize(size)
    
            val yValues = renderPassData.yValues
            for (i in 0 until size) {
                val value = yValues[i]
                if (value > maximum) {
                    strokeColors[i] = -0x10000
                    fillColors[i] = -0x10000
                } else if (value < minimum) {
                    strokeColors[i] = -0xff0100
                    fillColors[i] = -0x66ff0100
                } else {
                    strokeColors[i] = -0x100
                    fillColors[i] = -0x66000100
                }
            }
        }
    
        override fun getStrokeColors(): IntegerValues {
            return strokeColors
        }
    
        override fun getFillColors(): IntegerValues {
            return fillColors
        }
    
        override fun getPointMarkerColors(): IntegerValues {
            return fillColors
        }
    }
    

    Once a PaletteProvider class is ready, its instances can be used to set it for a RenderableSeries via the setPaletteProvider(renderableSeries.paletteProviders.IPaletteProvider paletteProvider) property:

    • Java
    • Java with Builders API
    • Kotlin
    final NumericAxis xAxis = new NumericAxis(requireContext());
    xAxis.setGrowBy(new DoubleRange(0.1, 0.1));
    
    final NumericAxis yAxis = new NumericAxis(requireContext());
    yAxis.setGrowBy(new DoubleRange(0.1, 0.1));
    
    final HorizontalLineAnnotation upperLimit = new HorizontalLineAnnotation(requireContext());
    upperLimit.setIsEditable(true);
    upperLimit.setStroke(new SolidPenStyle(Color.RED, false, 2f, null));
    upperLimit.setY1(2.7);
    
    final HorizontalLineAnnotation lowerLimit = new HorizontalLineAnnotation(requireContext());
    lowerLimit.setIsEditable(true);
    lowerLimit.setStroke(new SolidPenStyle(Color.GREEN, false, 2f, null));
    lowerLimit.setY1(2.5);
    
    DoubleSeries data1 = dataManager.getFourierSeries(1.0, 0.1, 5.02, 5.4, 5000);
    DoubleSeries data2 = dataManager.getFourierSeries(1.0, 0.1, 6.02, 6.4, 5000);
    DoubleSeries data3 = dataManager.getFourierSeries(1.0, 0.1, 7.02, 7.4, 5000);
    
    final XyDataSeries dataSeries1 = new XyDataSeries(Double.class, Double.class);
    final XyDataSeries dataSeries2 = new XyDataSeries(Double.class, Double.class);
    final XyDataSeries dataSeries3 = new XyDataSeries(Double.class, Double.class);
    
    dataSeries1.append(data1.xValues, data1.yValues);
    dataSeries2.append(data2.xValues, data2.yValues);
    dataSeries3.append(data3.xValues, data3.yValues);
    
    final SharedPaletteProvider sharedPaletteProvider = new SharedPaletteProvider(lowerLimit, upperLimit);
    
    final FastLineRenderableSeries lineSeries = new FastLineRenderableSeries();
    lineSeries.setPaletteProvider(sharedPaletteProvider);
    lineSeries.setDataSeries(dataSeries1);
    lineSeries.setStrokeStyle(new SolidPenStyle(0xFF279B27, false, 1.0f, null));
    
    final EllipsePointMarker marker = new EllipsePointMarker();
    marker.setSize(20, 20);
    marker.setStrokeStyle(new SolidPenStyle(Color.BLUE, false, 3.0f, null));
    marker.setFillStyle(new SolidBrushStyle(Color.BLUE));
    
    final XyScatterRenderableSeries scatterSeries = new XyScatterRenderableSeries();
    scatterSeries.setPointMarker(marker);
    scatterSeries.setPaletteProvider(sharedPaletteProvider);
    scatterSeries.setDataSeries(dataSeries2);
    scatterSeries.setStrokeStyle(new SolidPenStyle(0xFF279B27, false, 1.0f, null));
    
    final FastMountainRenderableSeries mountainSeries = new FastMountainRenderableSeries();
    scatterSeries.setPaletteProvider(sharedPaletteProvider);
    mountainSeries.setDataSeries(dataSeries3);
    mountainSeries.setStrokeStyle(new SolidPenStyle(0xFF279B27, false, 1.0f, null));
    
    UpdateSuspender.using(surface, () -> {
        surface.getXAxes().add(xAxis);
        surface.getYAxes().add(yAxis);
        Collections.addAll(surface.getRenderableSeries(), lineSeries, scatterSeries, mountainSeries);
        Collections.addAll(surface.getAnnotations(), lowerLimit, upperLimit);
        surface.getChartModifiers().add(createDefaultModifiers());
    });
    
    final NumericAxis xAxis = sciChartBuilder.newNumericAxis()
            .withGrowBy(0.1, 0.1)
            .build();
    
    final NumericAxis yAxis = sciChartBuilder.newNumericAxis()
            .withGrowBy(0.1, 0.1)
            .build();
    
    final HorizontalLineAnnotation upperLimit = sciChartBuilder.newHorizontalLineAnnotation()
            .withIsEditable(true)
            .withStroke(2f, Color.RED)
            .withY1(2.7)
            .build();
    
    final HorizontalLineAnnotation lowerLimit = sciChartBuilder.newHorizontalLineAnnotation()
            .withIsEditable(true)
            .withStroke(2f, Color.GREEN)
            .withY1(2.5)
            .build();
    
    DoubleSeries data1 = dataManager.getFourierSeries(1.0, 0.1, 5.02, 5.4, 5000);
    DoubleSeries data2 = dataManager.getFourierSeries(1.0, 0.1, 6.02, 6.4, 5000);
    DoubleSeries data3 = dataManager.getFourierSeries(1.0, 0.1, 7.02, 7.4, 5000);
    
    final XyDataSeries dataSeries1 = new XyDataSeries(Double.class, Double.class);
    final XyDataSeries dataSeries2 = new XyDataSeries(Double.class, Double.class);
    final XyDataSeries dataSeries3 = new XyDataSeries(Double.class, Double.class);
    
    dataSeries1.append(data1.xValues, data1.yValues);
    dataSeries2.append(data2.xValues, data2.yValues);
    dataSeries3.append(data3.xValues, data3.yValues);
    
    final SharedPaletteProvider sharedPaletteProvider = new SharedPaletteProvider(lowerLimit, upperLimit);
    
    final FastLineRenderableSeries lineSeries = sciChartBuilder.newLineSeries()
            .withPaletteProvider(sharedPaletteProvider)
            .withDataSeries(dataSeries1)
            .withStrokeStyle(0xFF279B27, 1.0f)
            .build();
    
    final EllipsePointMarker marker = sciChartBuilder.newPointMarker(new EllipsePointMarker())
            .withSize(20)
            .withStroke(Color.BLUE, 3f)
            .withFill(Color.BLUE)
            .build();
    
    final XyScatterRenderableSeries scatterSeries = sciChartBuilder.newScatterSeries()
            .withPointMarker(marker)
            .withPaletteProvider(sharedPaletteProvider)
            .withDataSeries(dataSeries2)
            .withStrokeStyle(0xFF279B27, 1.0f)
            .build();
    
    final FastMountainRenderableSeries mountainSeries = sciChartBuilder.newMountainSeries()
            .withPaletteProvider(sharedPaletteProvider)
            .withDataSeries(dataSeries3)
            .withStrokeStyle(0xFF279B27, 1.0f)
            .build();
    
    UpdateSuspender.using(surface, () -> {
        surface.getXAxes().add(xAxis);
        surface.getYAxes().add(yAxis);
        Collections.addAll(surface.getRenderableSeries(), lineSeries, scatterSeries, mountainSeries);
        Collections.addAll(surface.getAnnotations(), lowerLimit, upperLimit);
        surface.getChartModifiers().add(createDefaultModifiers());
    });
    
    val xAxis = NumericAxis(requireContext())
    xAxis.growBy = DoubleRange(0.1, 0.1)
    
    val yAxis = NumericAxis(requireContext())
    yAxis.growBy = DoubleRange(0.1, 0.1)
    
    val upperLimit = HorizontalLineAnnotation(requireContext())
    upperLimit.setIsEditable(true)
    upperLimit.stroke = SolidPenStyle(Color.RED, false, 2f, null)
    upperLimit.y1 = 2.7
    
    val lowerLimit = HorizontalLineAnnotation(requireContext())
    lowerLimit.setIsEditable(true)
    lowerLimit.stroke = SolidPenStyle(Color.GREEN, false, 2f, null)
    lowerLimit.y1 = 2.5
    
    val data1: DoubleSeries = dataManager.getFourierSeries(1.0, 0.1, 5.02, 5.4, 5000)
    val data2: DoubleSeries = dataManager.getFourierSeries(1.0, 0.1, 6.02, 6.4, 5000)
    val data3: DoubleSeries = dataManager.getFourierSeries(1.0, 0.1, 7.02, 7.4, 5000)
    
    val dataSeries1: XyDataSeries<Double, Double> = XyDataSeries(Double::class.java, Double::class.java)
    val dataSeries2: XyDataSeries<Double, Double> = XyDataSeries(Double::class.java, Double::class.java)
    val dataSeries3: XyDataSeries<Double, Double> = XyDataSeries(Double::class.java, Double::class.java)
    
    dataSeries1.append(data1.xValues, data1.yValues)
    dataSeries2.append(data2.xValues, data2.yValues)
    dataSeries3.append(data3.xValues, data3.yValues)
    
    val sharedPaletteProvider = SharedPaletteProvider(lowerLimit, upperLimit)
    val lineSeries = FastLineRenderableSeries()
    lineSeries.paletteProvider = sharedPaletteProvider
    lineSeries.dataSeries = dataSeries1
    lineSeries.strokeStyle = SolidPenStyle(-0xd864d9, false, 1.0f, null)
    
    val marker = EllipsePointMarker()
    marker.setSize(20, 20)
    marker.strokeStyle = SolidPenStyle(Color.BLUE, false, 3.0f, null)
    marker.fillStyle = SolidBrushStyle(Color.BLUE)
    
    val scatterSeries = XyScatterRenderableSeries()
    scatterSeries.pointMarker = marker
    scatterSeries.paletteProvider = sharedPaletteProvider
    scatterSeries.dataSeries = dataSeries2
    scatterSeries.strokeStyle = SolidPenStyle(-0xd864d9, false, 1.0f, null)
    
    val mountainSeries = FastMountainRenderableSeries()
    scatterSeries.paletteProvider = sharedPaletteProvider
    mountainSeries.dataSeries = dataSeries3
    mountainSeries.strokeStyle = SolidPenStyle(-0xd864d9, false, 1.0f, null)
    
    UpdateSuspender.using(surface) {
        surface.xAxes.add(xAxis)
        surface.yAxes.add(yAxis)
        Collections.addAll(surface.renderableSeries, lineSeries, scatterSeries, mountainSeries)
        Collections.addAll(surface.annotations, lowerLimit, upperLimit)
        surface.chartModifiers.add(createDefaultModifiers())
    }
    

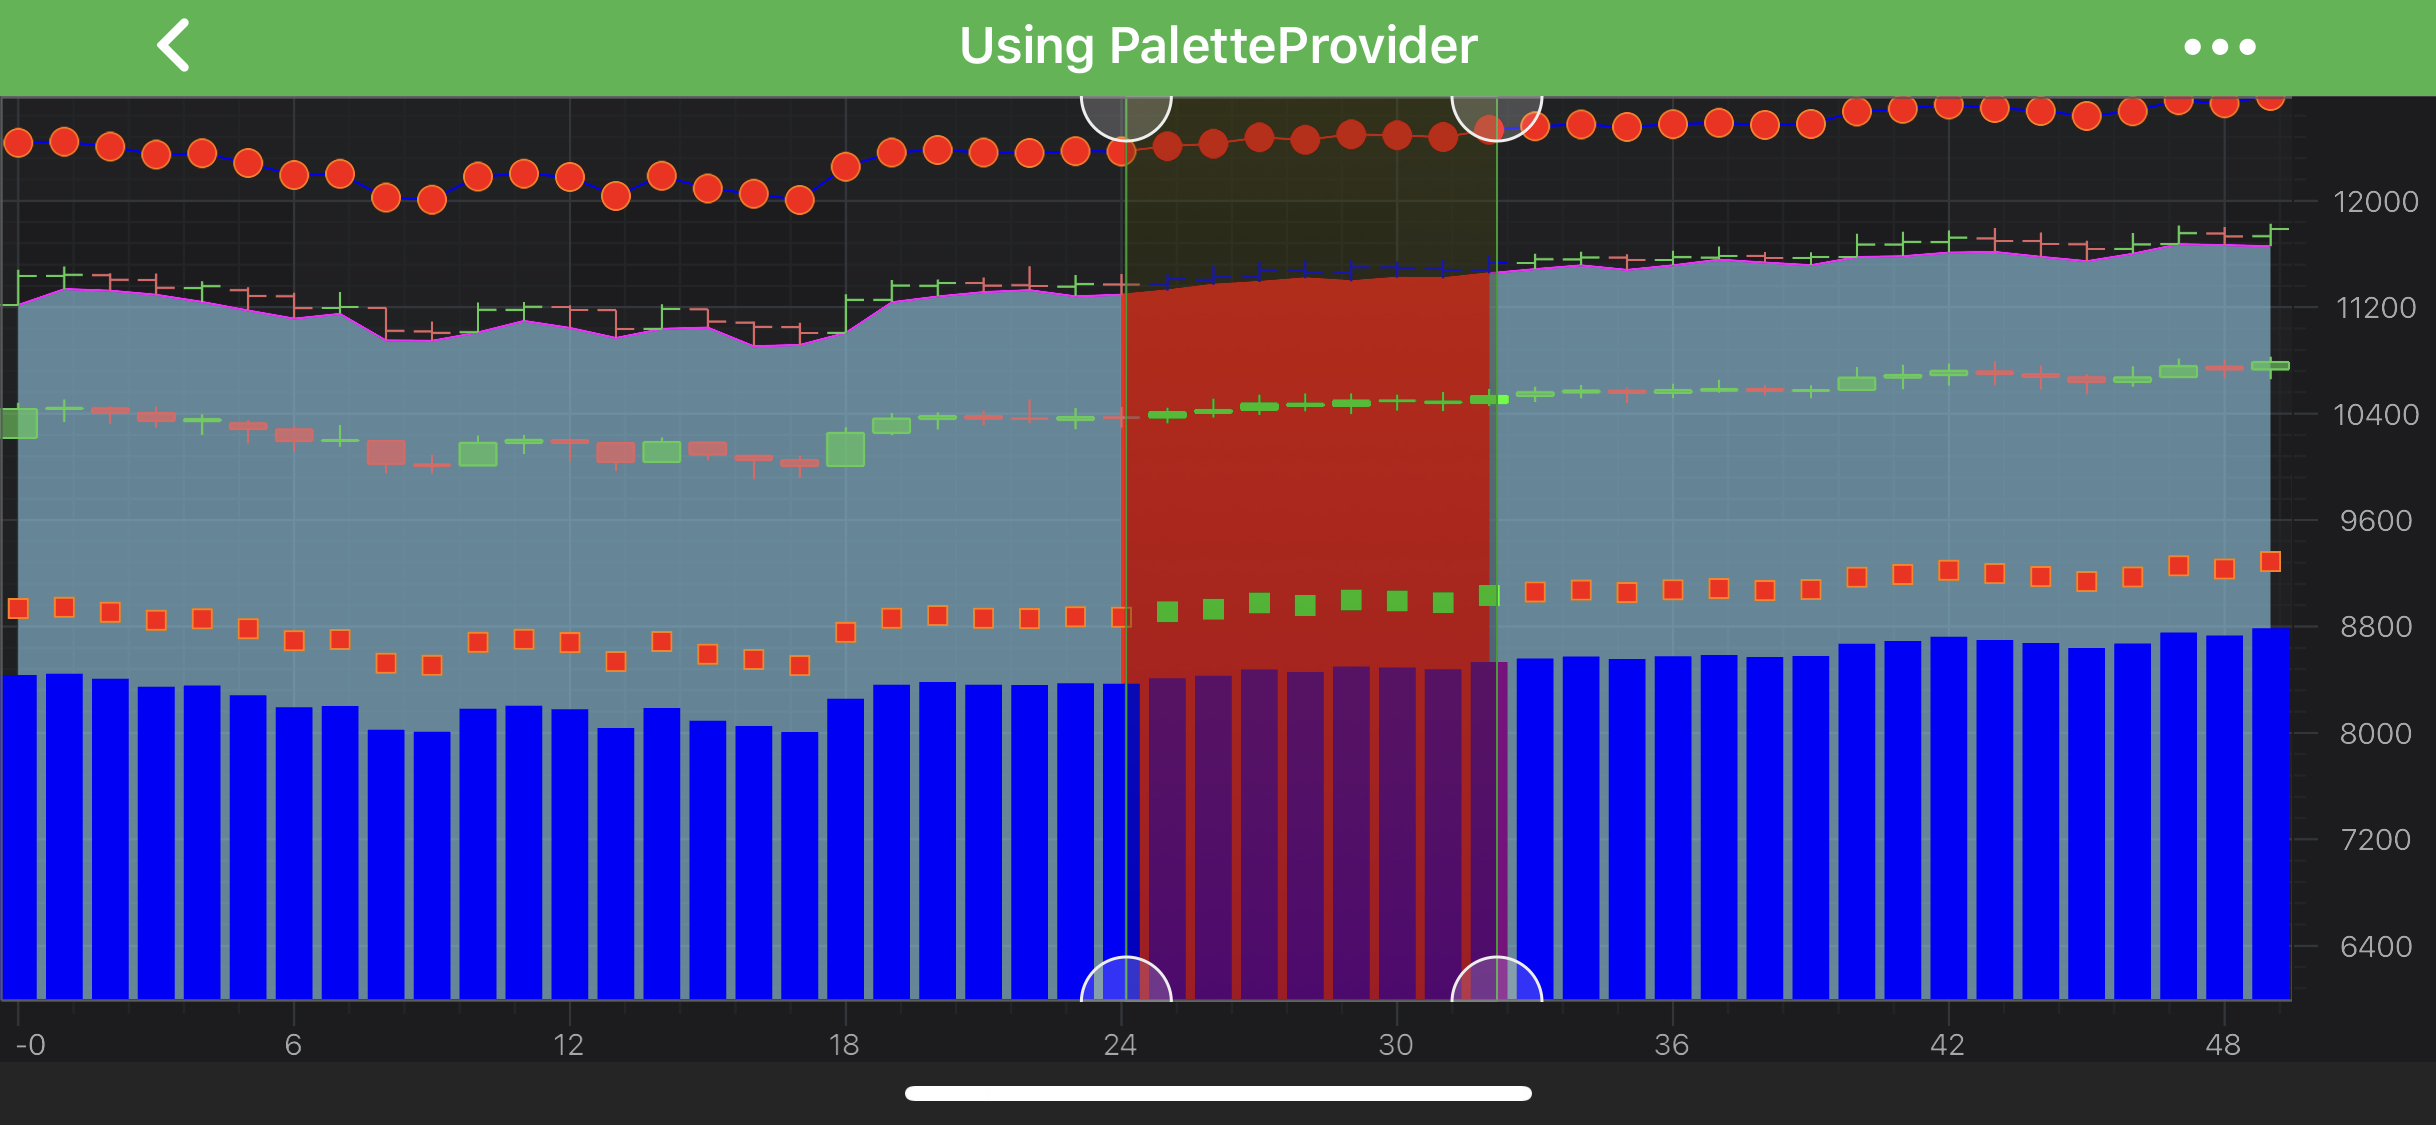
    The code above results in a chart with renderableSeries listed below:

    • Line Series
    • Scatter Series
    • Mountain (Area) Series

    These charts are changing colors depending on the threshold levels provided by two Horizontal Line Annotations:

    Note

    The DataManager is just a class, that provides stub data for Example Suite

    Back to top © 2011-2025 SciChart. All rights reserved. | sitemap.xml