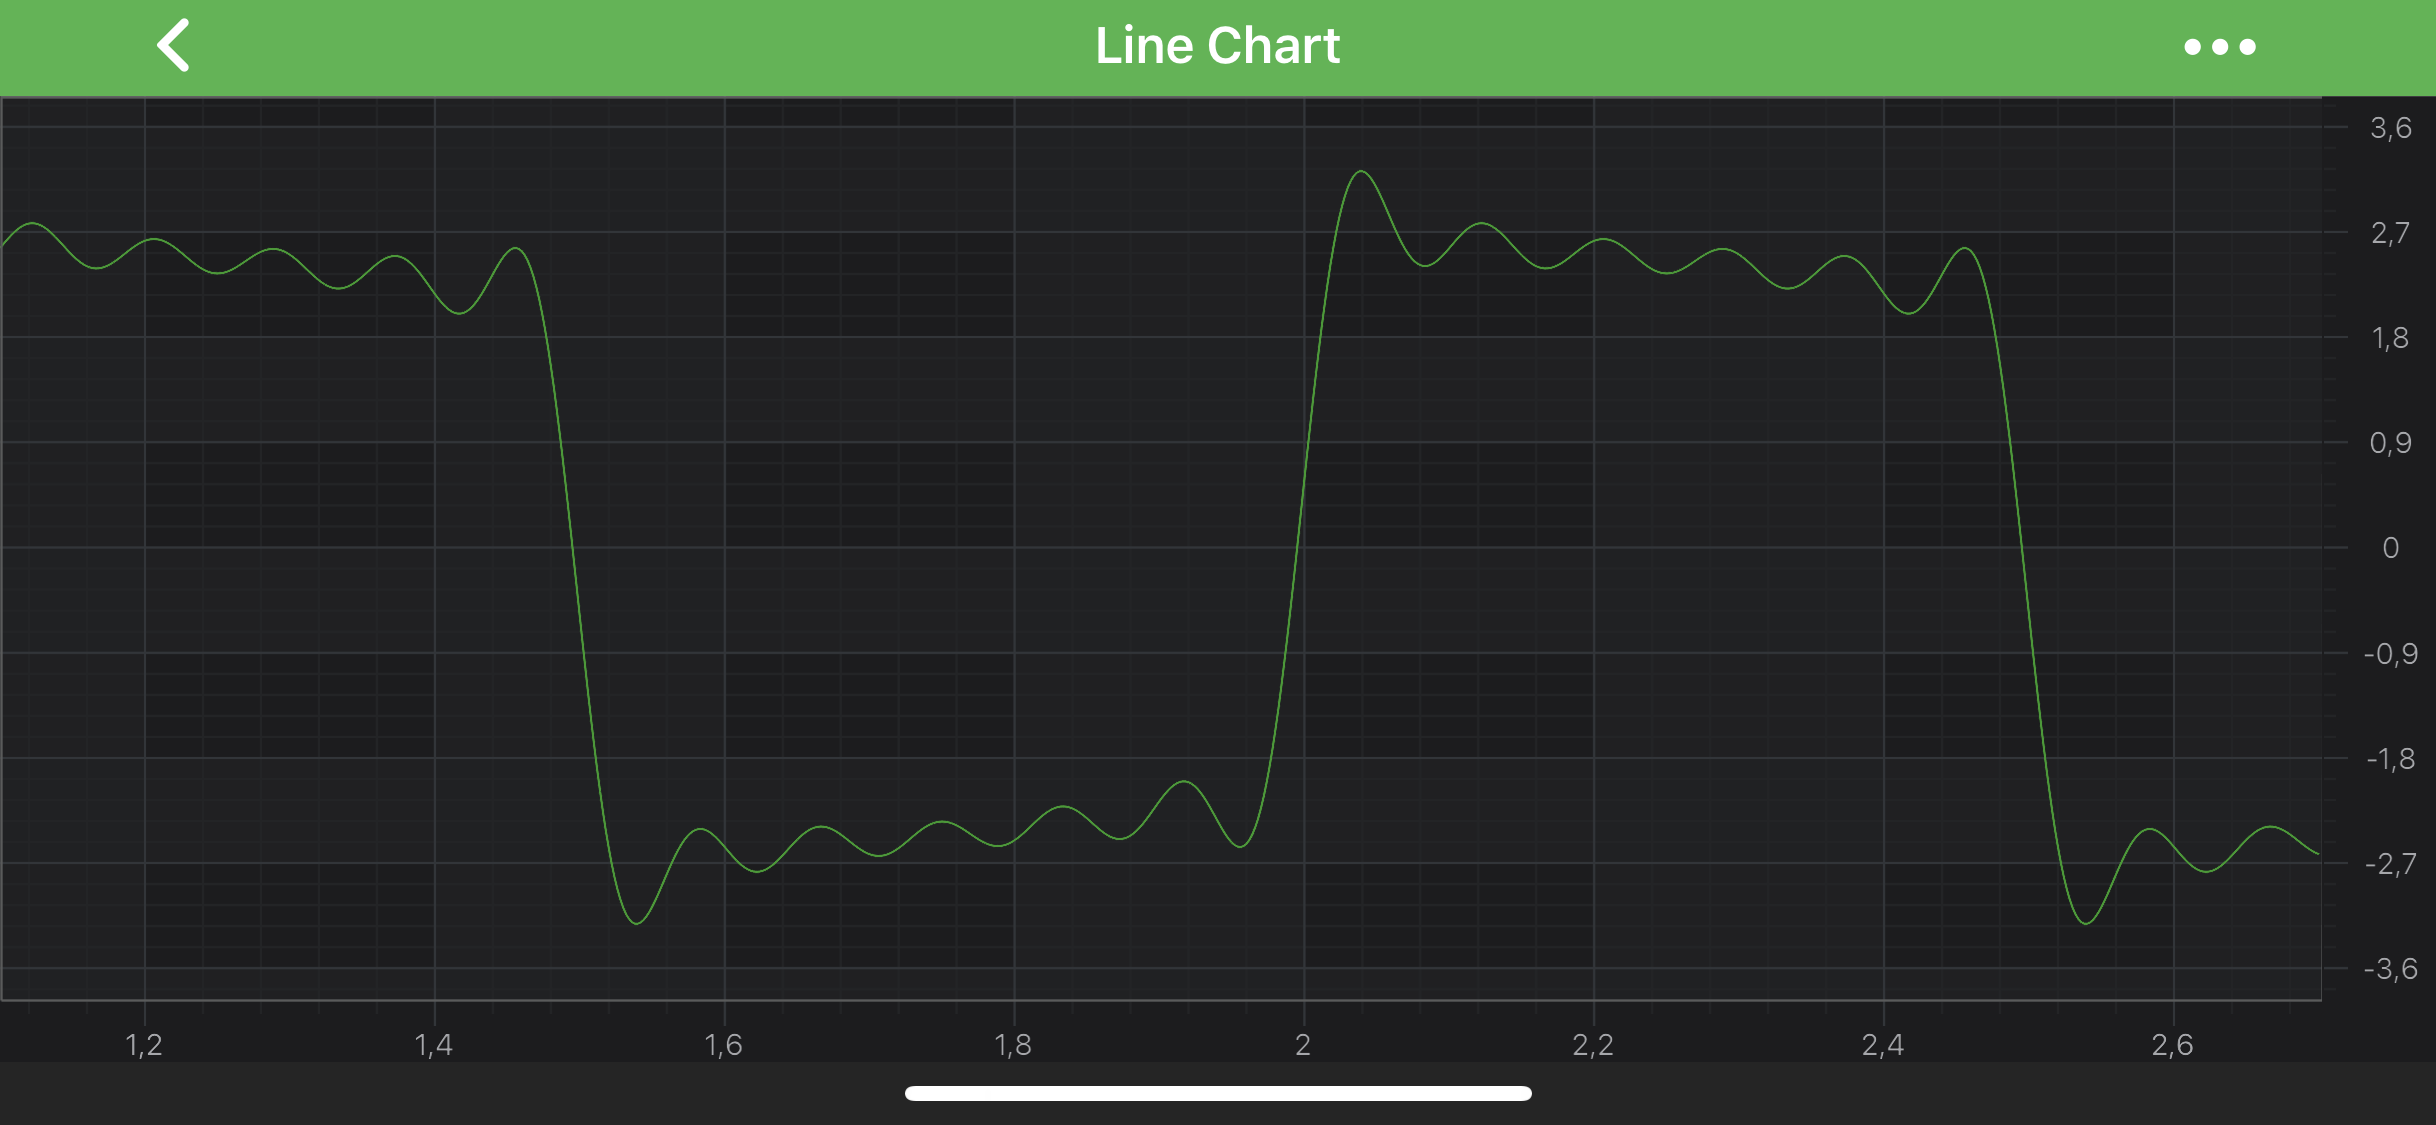
The Line Series Type
Line Series can be created using the FastLineRenderableSeries type.
Note
Examples of the Line Series can be found in the SciChart Android Examples Suite as well as on GitHub
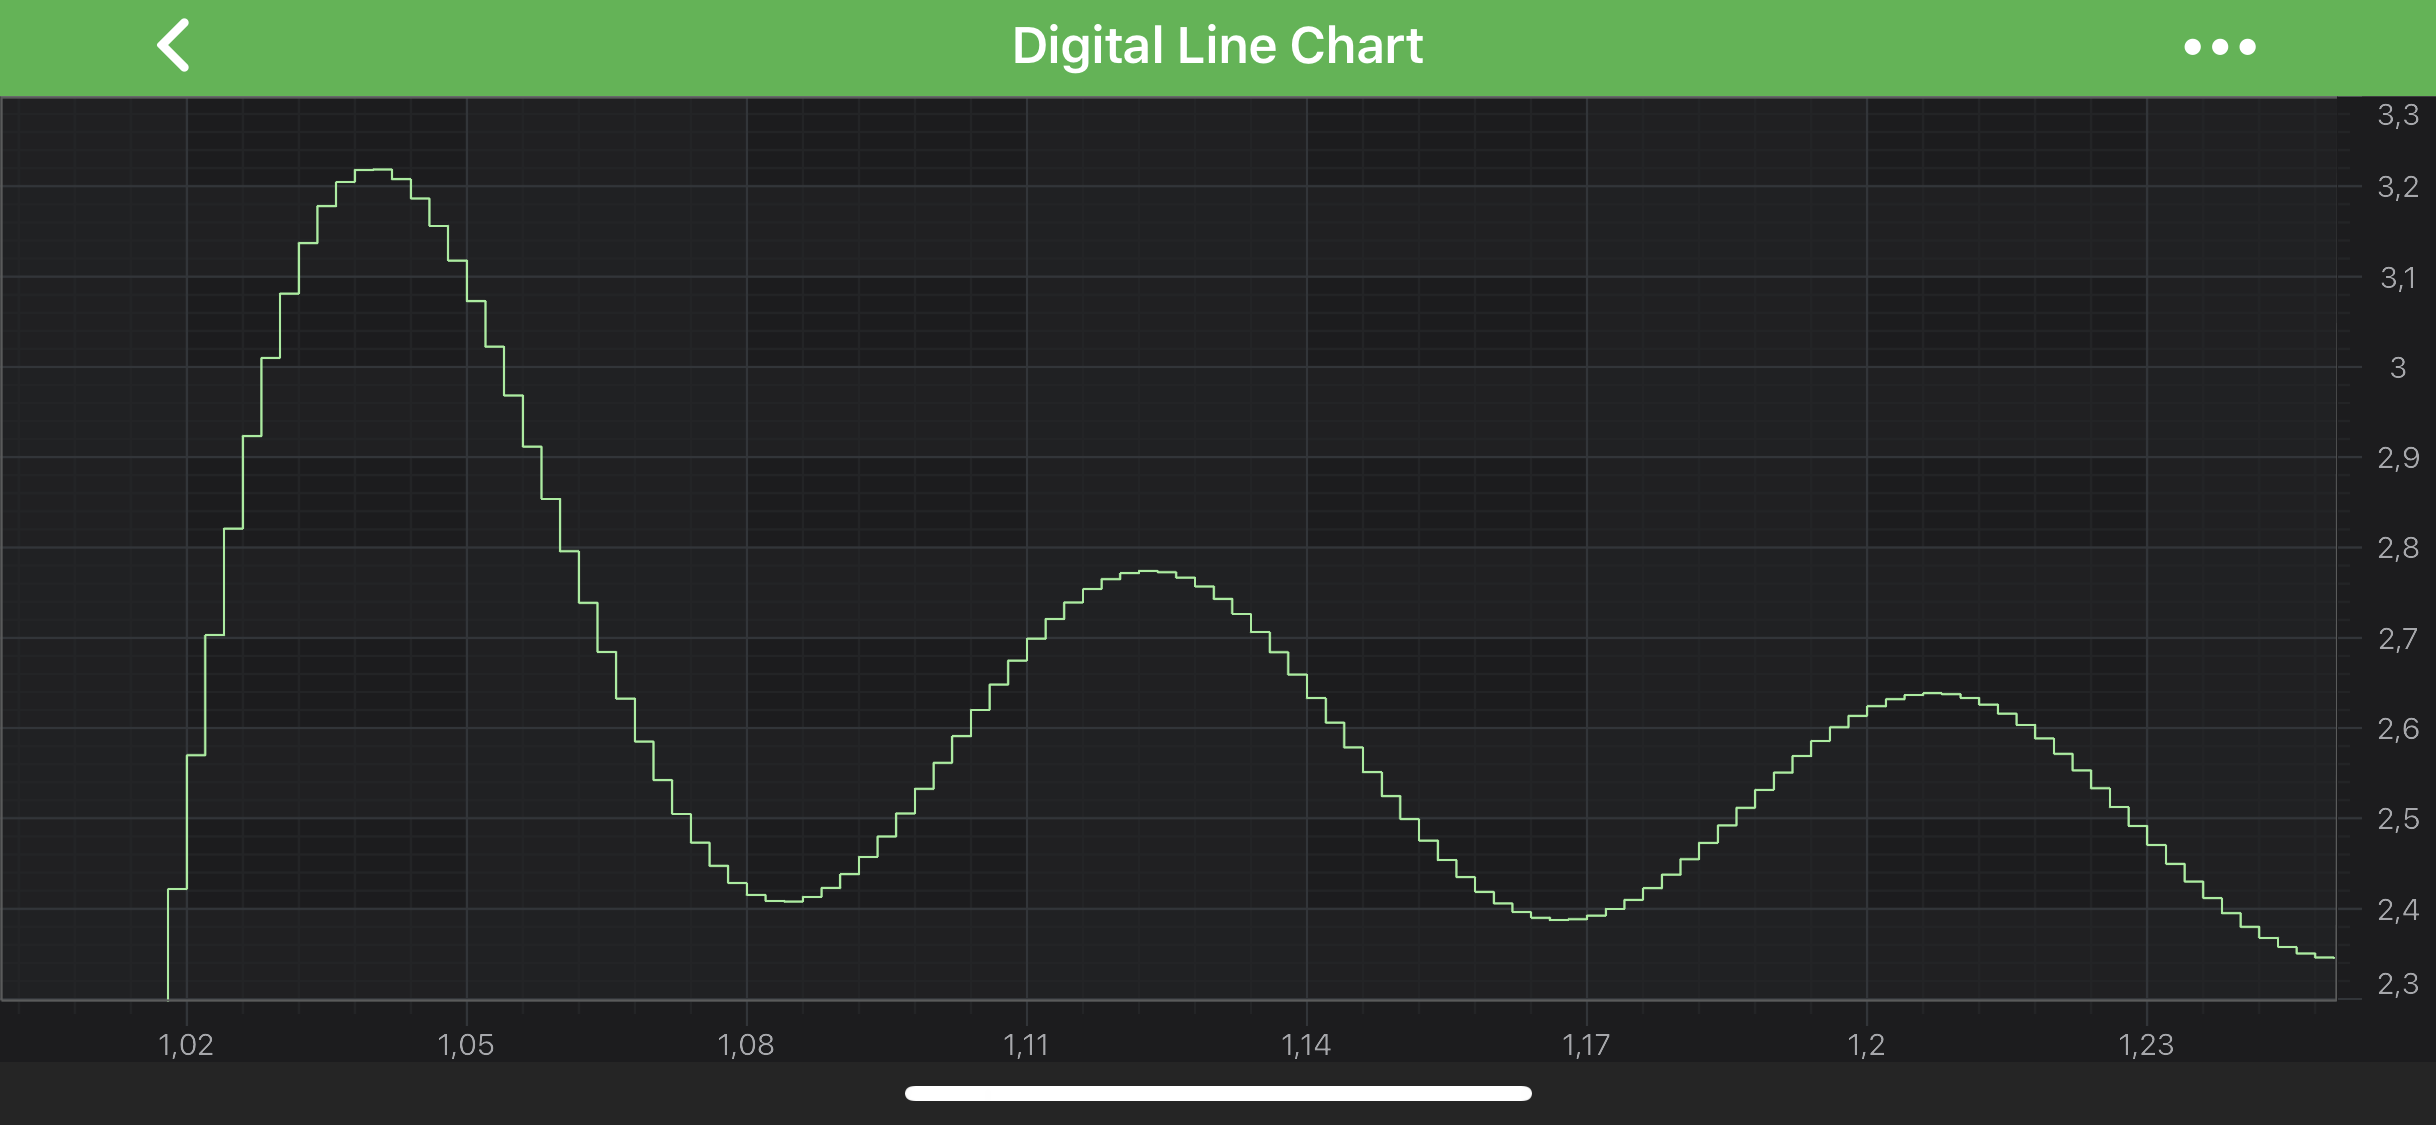
Digital (Step) Line Series
FastLineRenderableSeries can be configured to draw as Digital (Step) Line. It is achieved via the isDigitalLine property.
@Override
protected void initExample(@NonNull SciChartSurface surface) {
    final IXyDataSeries<Double, Double> dataSeries = new XyDataSeries<>(Double.class, Double.class);
    dataSeries.append(0.0, 0.0);
    dataSeries.append(1.0, 1.0);
    dataSeries.append(2.0, 4.0);

    final FastLineRenderableSeries lineSeries = new FastLineRenderableSeries();

    lineSeries.setDataSeries(dataSeries);
    lineSeries.setStrokeStyle(new SolidPenStyle(Color.RED, true, 1f, null));

    UpdateSuspender.using(surface, () -> {
        Collections.addAll(surface.getXAxes(), new NumericAxis(requireContext()));
        Collections.addAll(surface.getYAxes(), new NumericAxis(requireContext()));

        Collections.addAll(surface.getRenderableSeries(), lineSeries);
    });
}
In the code above, a Line Series instance is created. It is assigned to draw the data that is provided by the IDataSeries<TX,TY> assigned to it. The line is drawn with a Pen provided by the PenStyle instance. Finally, the Line Series is added to the renderableSeries property.
Line Series Features
Line Series also has some features similar to other series, such as:
Render a Gap in a Line Series
It is possible to show a gap in a Line Series by passing a data point with a NaN as the Y value. Please refer to the RenderableSeries APIs article for more details. The FastLineRenderableSeries, however, allows to specify how a gap should appear. You can treat NAN values as gaps or close the line. That's defined by the drawNaNAs property (Please see LineDrawMode enumeration).
Add Point Markers onto a Line Series
Every data point of a Line Series can be marked with a IPointMarker. To add Point Markers to the Line Series, use the following code:
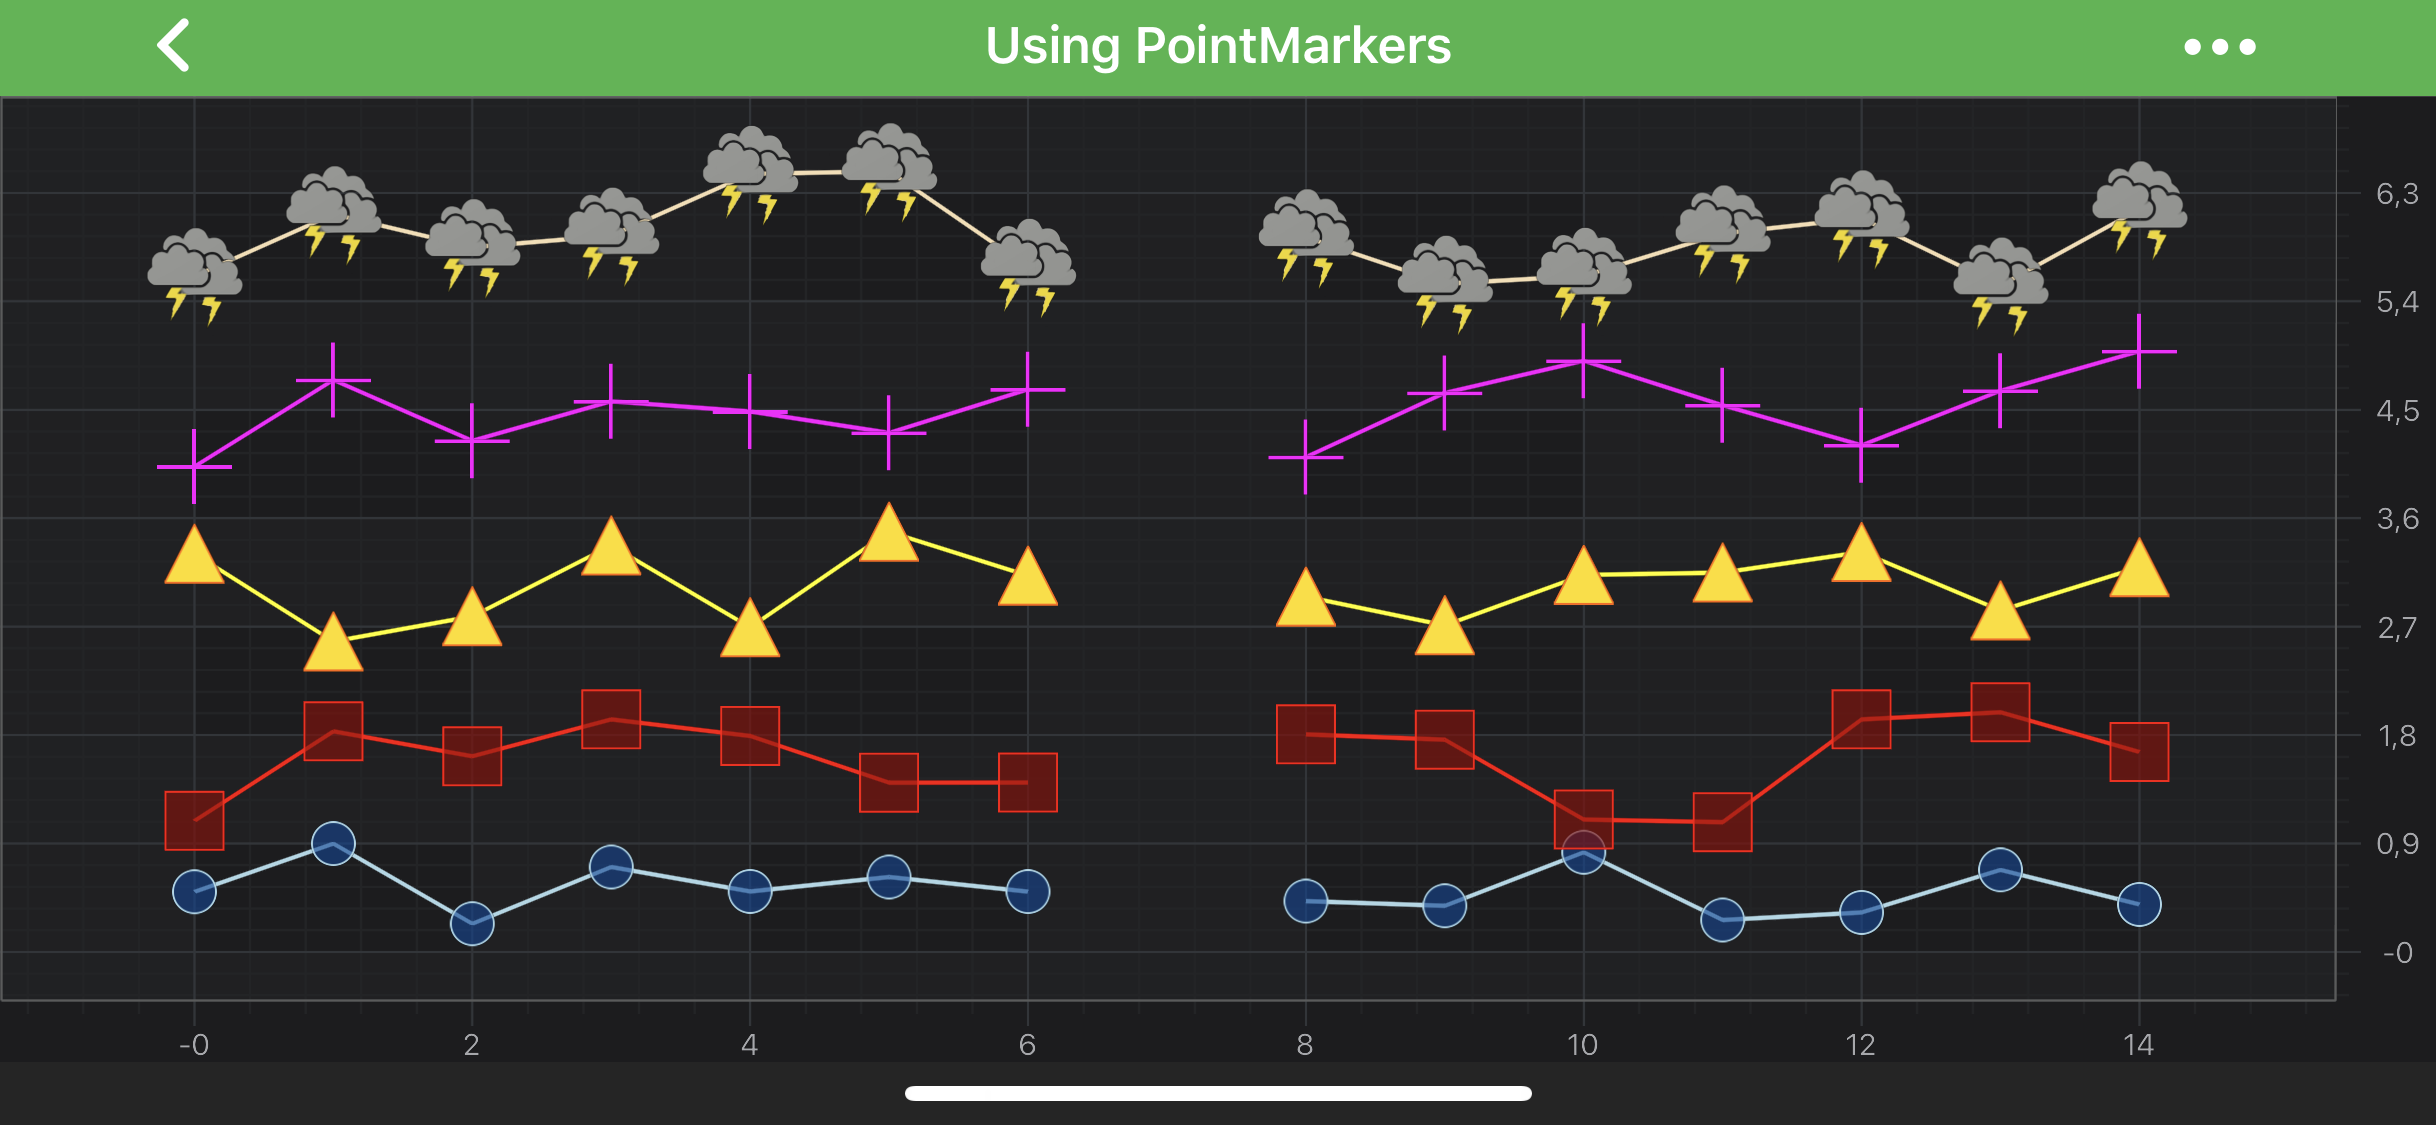
To learn more about Point Markers, please refer to the PointMarkers API article.
Note
If we do not need lines then we can use Scatter Series.
Paint Line Segments With Different Colors
In SciChart, you can draw line segments with different colors using the PaletteProvider API. To Use palette provider for Line Series - a custom IPaletteProvider has to be provided to the paletteProvider property. For more information - please refer to the PaletteProvider API article.