The Donut Chart Type
In SciChart, the Donut Chart type is represented by the SciPieChartSurface class.
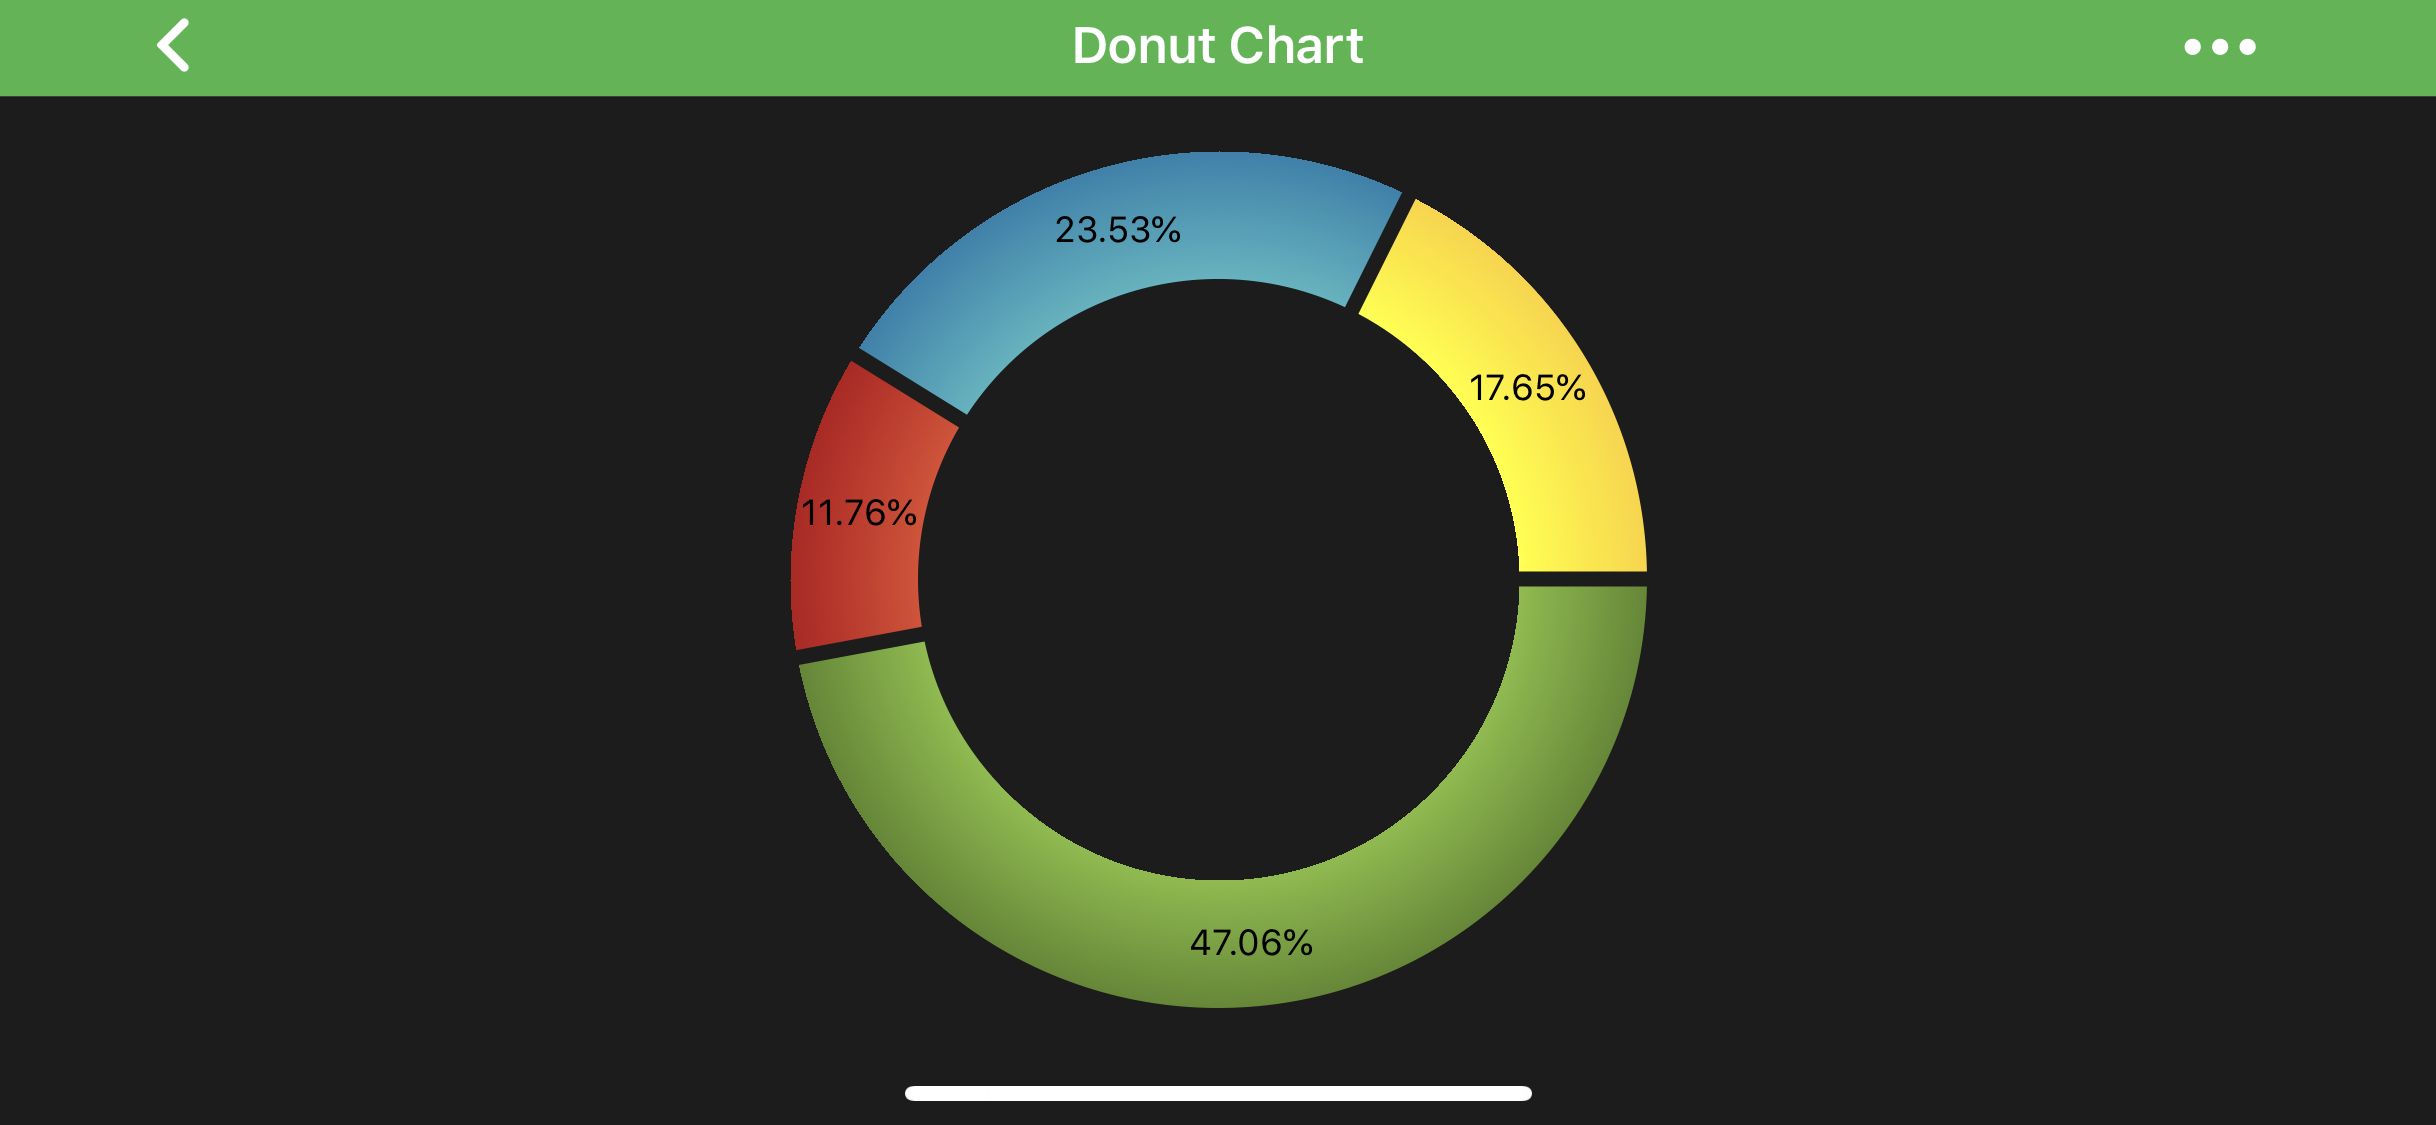
The DonutRenderableSeries is very similar to the Pie Chart, except it has a round hole in its center. A PieSegment represents a percentage that corresponds to a particular value. This value appears drawn on every segment and can be set in code.
Note
Examples for the Donut Chart can be found in the SciChart Android Examples Suite as well as on GitHub:
The PieSegment allows you to specify different styles to control rendering of the segments, e.g.:
Note
To learn more about Pens and Brushes and how to utilize them, please refer to the PenStyle, BrushStyle and FontStyle article.
Also, you can control whether to draw labels on segments or not via the drawLabels property.
Create a Donut Chart
To create a Donut Chart, you have to provide a PieRenderableSeriesCollection and assign it to renderableSeries property. The data source is a collection of objects that conforms to the IPieRenderableSeries protocol, which contains a list of PieSegment instances to draw.
@Override
protected void initExample(@NonNull SciPieChartSurface surface) {
    final DonutRenderableSeries donutSeries = new DonutRenderableSeries();

    final PieSegmentCollection segmentsCollection = donutSeries.getSegmentsCollection();
    segmentsCollection.add(createSegment(40, "Green", 0xff84BC3D, 0xff5B8829));
    segmentsCollection.add(createSegment(10, "Red",0xffe04a2f, 0xffB7161B));
    segmentsCollection.add(createSegment(20, "Blue",0xff4AB6C1, 0xff2182AD));
    segmentsCollection.add(createSegment(15, "Yellow",0xff84BC3D, 0xff5B8829));

    UpdateSuspender.using(surface, () -> {
        Collections.addAll(surface.getRenderableSeries(), donutSeries);
    });
}

private PieSegment createSegment(double value, String title, int gradientStart, int gradientEnd) {
    final PieSegment pieSegment = new PieSegment();

    pieSegment.setValue(value);
    pieSegment.setTitle(title);
    pieSegment.setFillStyle(new RadialGradientBrushStyle(0.5F, 0.5F, 0.5F, 0.5F, gradientStart, gradientEnd));

    return pieSegment;
}
Changing the size of the Donut Chart
If you want to change the size of the Donut Chart you can use a combination of the following properties:
The above allows you to specify how much space the Donut Chart should use for its rendering. If you use Absolute mode then height accepts size in pixels, and if you use Relative mode, it expects value from 0 to 1, which tells how much of the available space it should use for rendering (e.g. 0.5 will tell Donut series to use 50% of available space).
Also, you can control the center hole size via the holeRadius property.
SCIPieChartSurface Modifiers
The SciPieChartSurface supports modifiers like Legend, Selection, and Tooltip.

Legend and Selection modifiers are synced if both are added. A PieSegment can be selected by clicking on either of them (via the Selection Modifier) or the corresponding item in the Legend. This action provides visual feedback on the chart and the Legend.
Donut Chart Legend
To add the PieChartLegendModifier, use the following code:
final PieChartLegendModifier legendModifier = new PieChartLegendModifier(getContext());
legendModifier.setSourceSeries(pieSeries);
legendModifier.setLegendPosition(Gravity.BOTTOM | Gravity.CENTER_HORIZONTAL, 17);

pieChartSurface.getChartModifiers().add(legendModifier);
Note
PieChartLegendModifier works similar to LegendModifier and has a similar API. To learn more, please visit the LegendModifier usage article.
Donut Chart Selection
To add the PieSegmentSelectionModifier please use the following code:
final PieSegmentSelectionModifier selectionModifier = new PieSegmentSelectionModifier();
pieChartSurface.getChartModifiers().add(selectionModifier);
Note
PieSegmentSelectionModifier works similar to SeriesSelectionModifier and has a similar API. To learn more, please visit the SeriesSelectionModifier usage article.
Donut Chart Tooltip
The PieChartTooltipModifier allows inspecting segmentCollection at a touch point. To add the PieChartTooltipModifier, use the following code:
pieChartSurface.getChartModifiers().add(new PieChartTooltipModifier());
Note
PieChartTooltipModifier works similar to TooltipModifier and has a similar API. To learn more, please visit TooltipModifier Usage article.
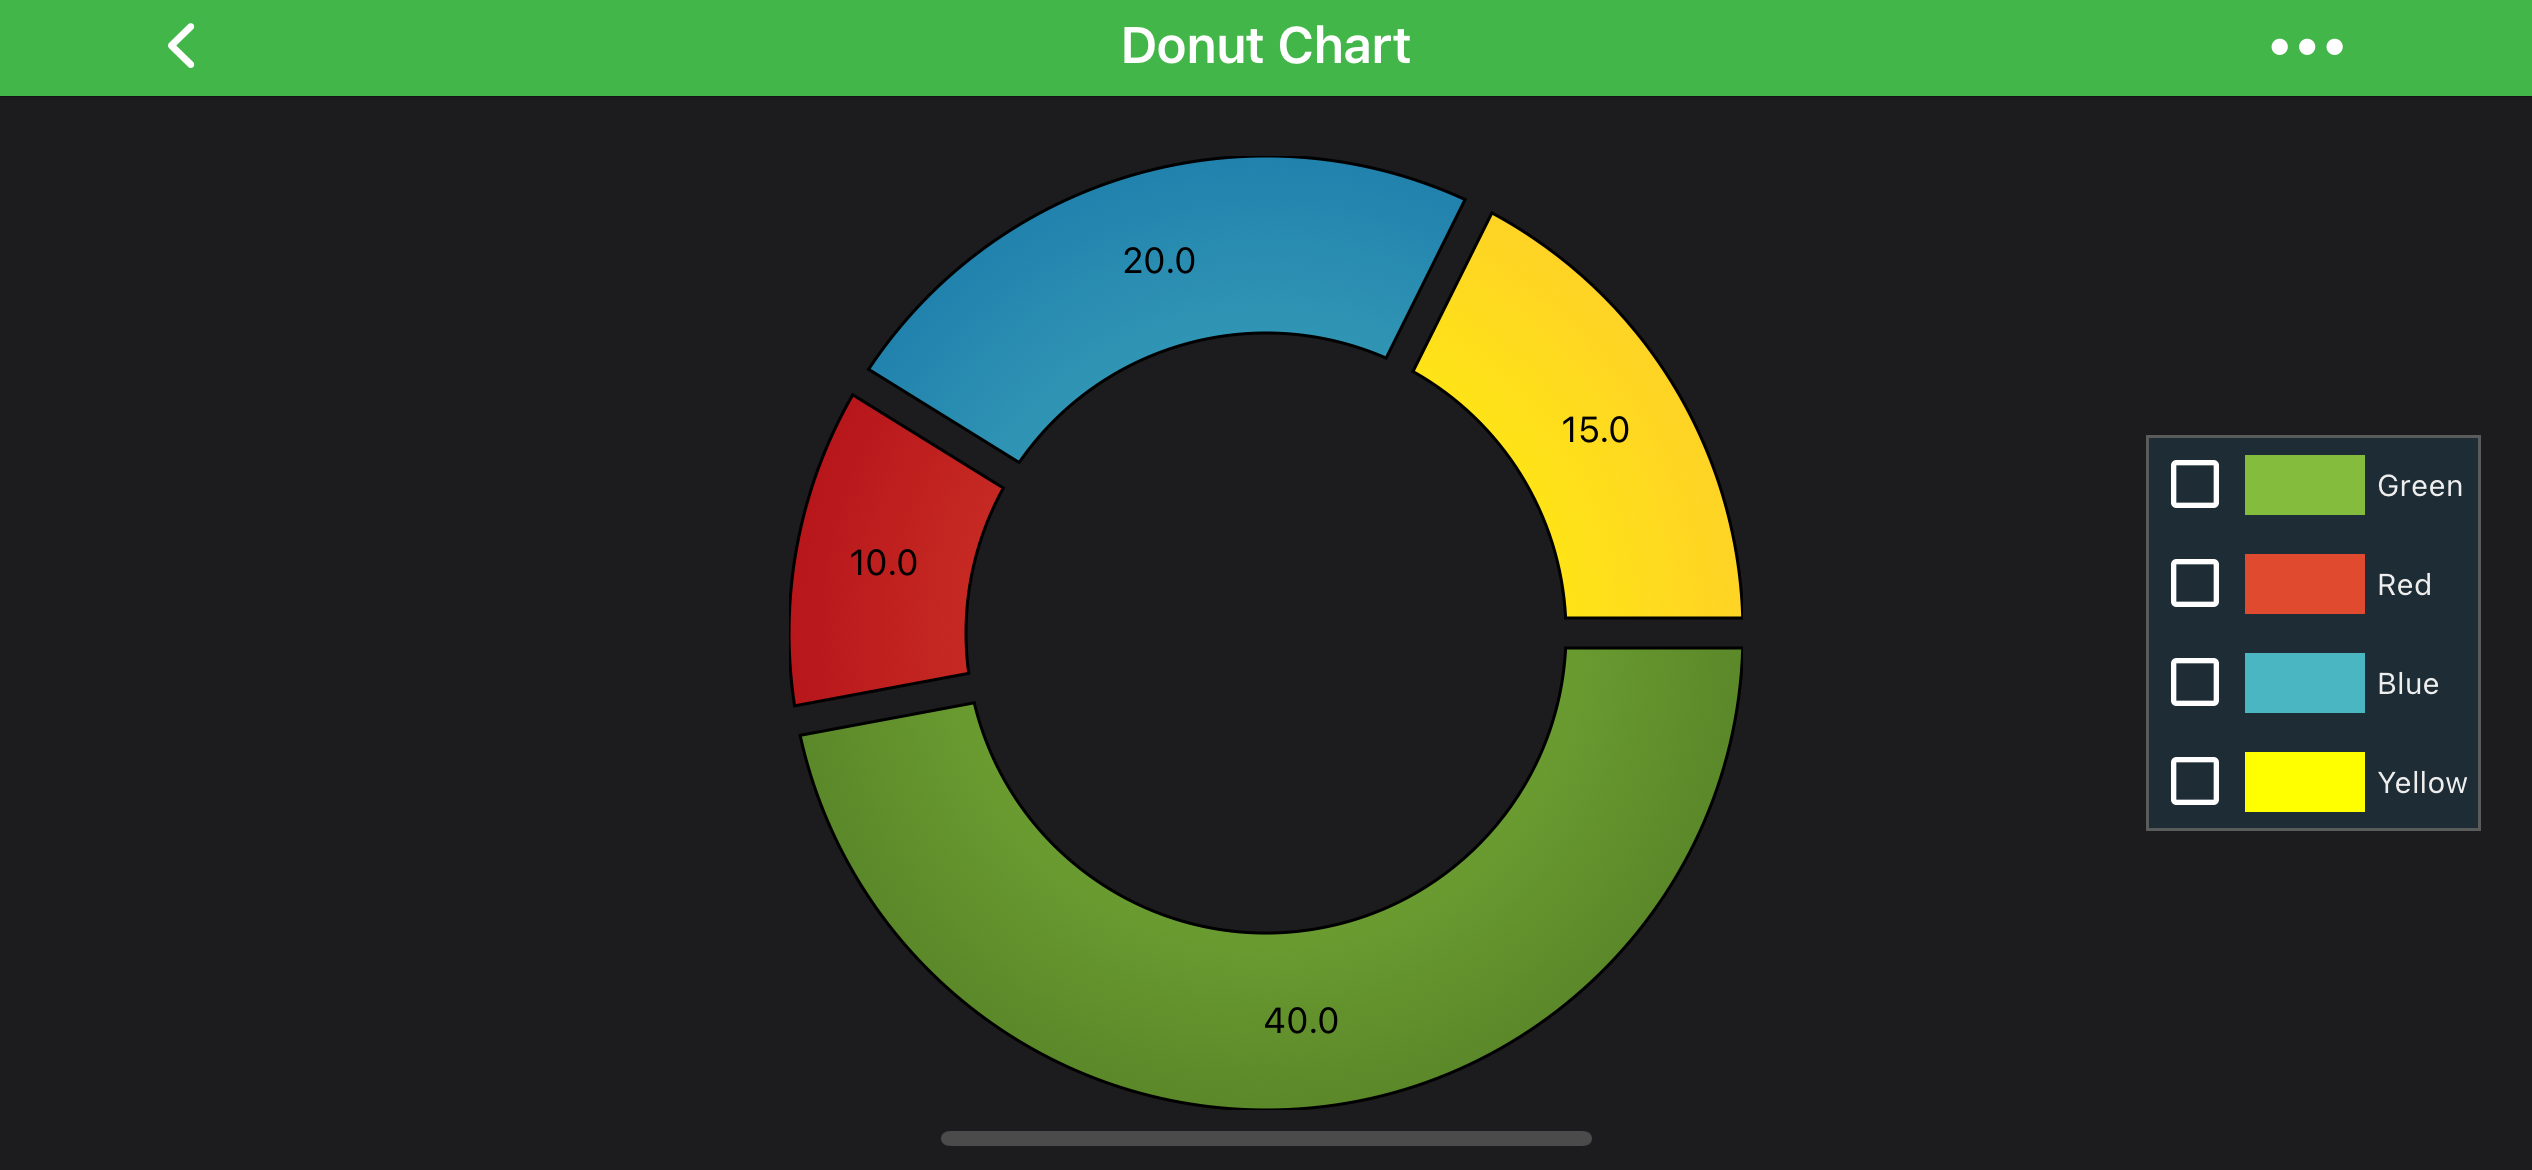
Pie Segment Label Formatter
By default, the Pie Segment Label displays a relative percentage calculated on values of all segments in segmentCollection. This behavior can be controlled and to do so you’ll need to subclass PieSegmentLabelFormatterBase and provide your custom data in formatLabel(renderableSeries.IPieSegment pieSegment) method. As an example, let's create a label that displays a segment absolute value. Assume, we create a donutSeries and add four segments with values 40, 10, 20, and 15. Here is the code sample, how to do this:
class CustomPieSegmentLabelFormatter extends PieSegmentLabelFormatterBase {
    @Override
    public CharSequence formatLabel(IPieSegment pieSegment) {
        return String.format("%.1f", pieSegment.getValue());
    }
}
// Assume a donutSeries has been created somewhere
final DonutRenderableSeries donutSeries = new DonutRenderableSeries();
donutSeries.setPieSegmentLabelFormatter(new CustomPieSegmentLabelFormatter());
This produces the following output:
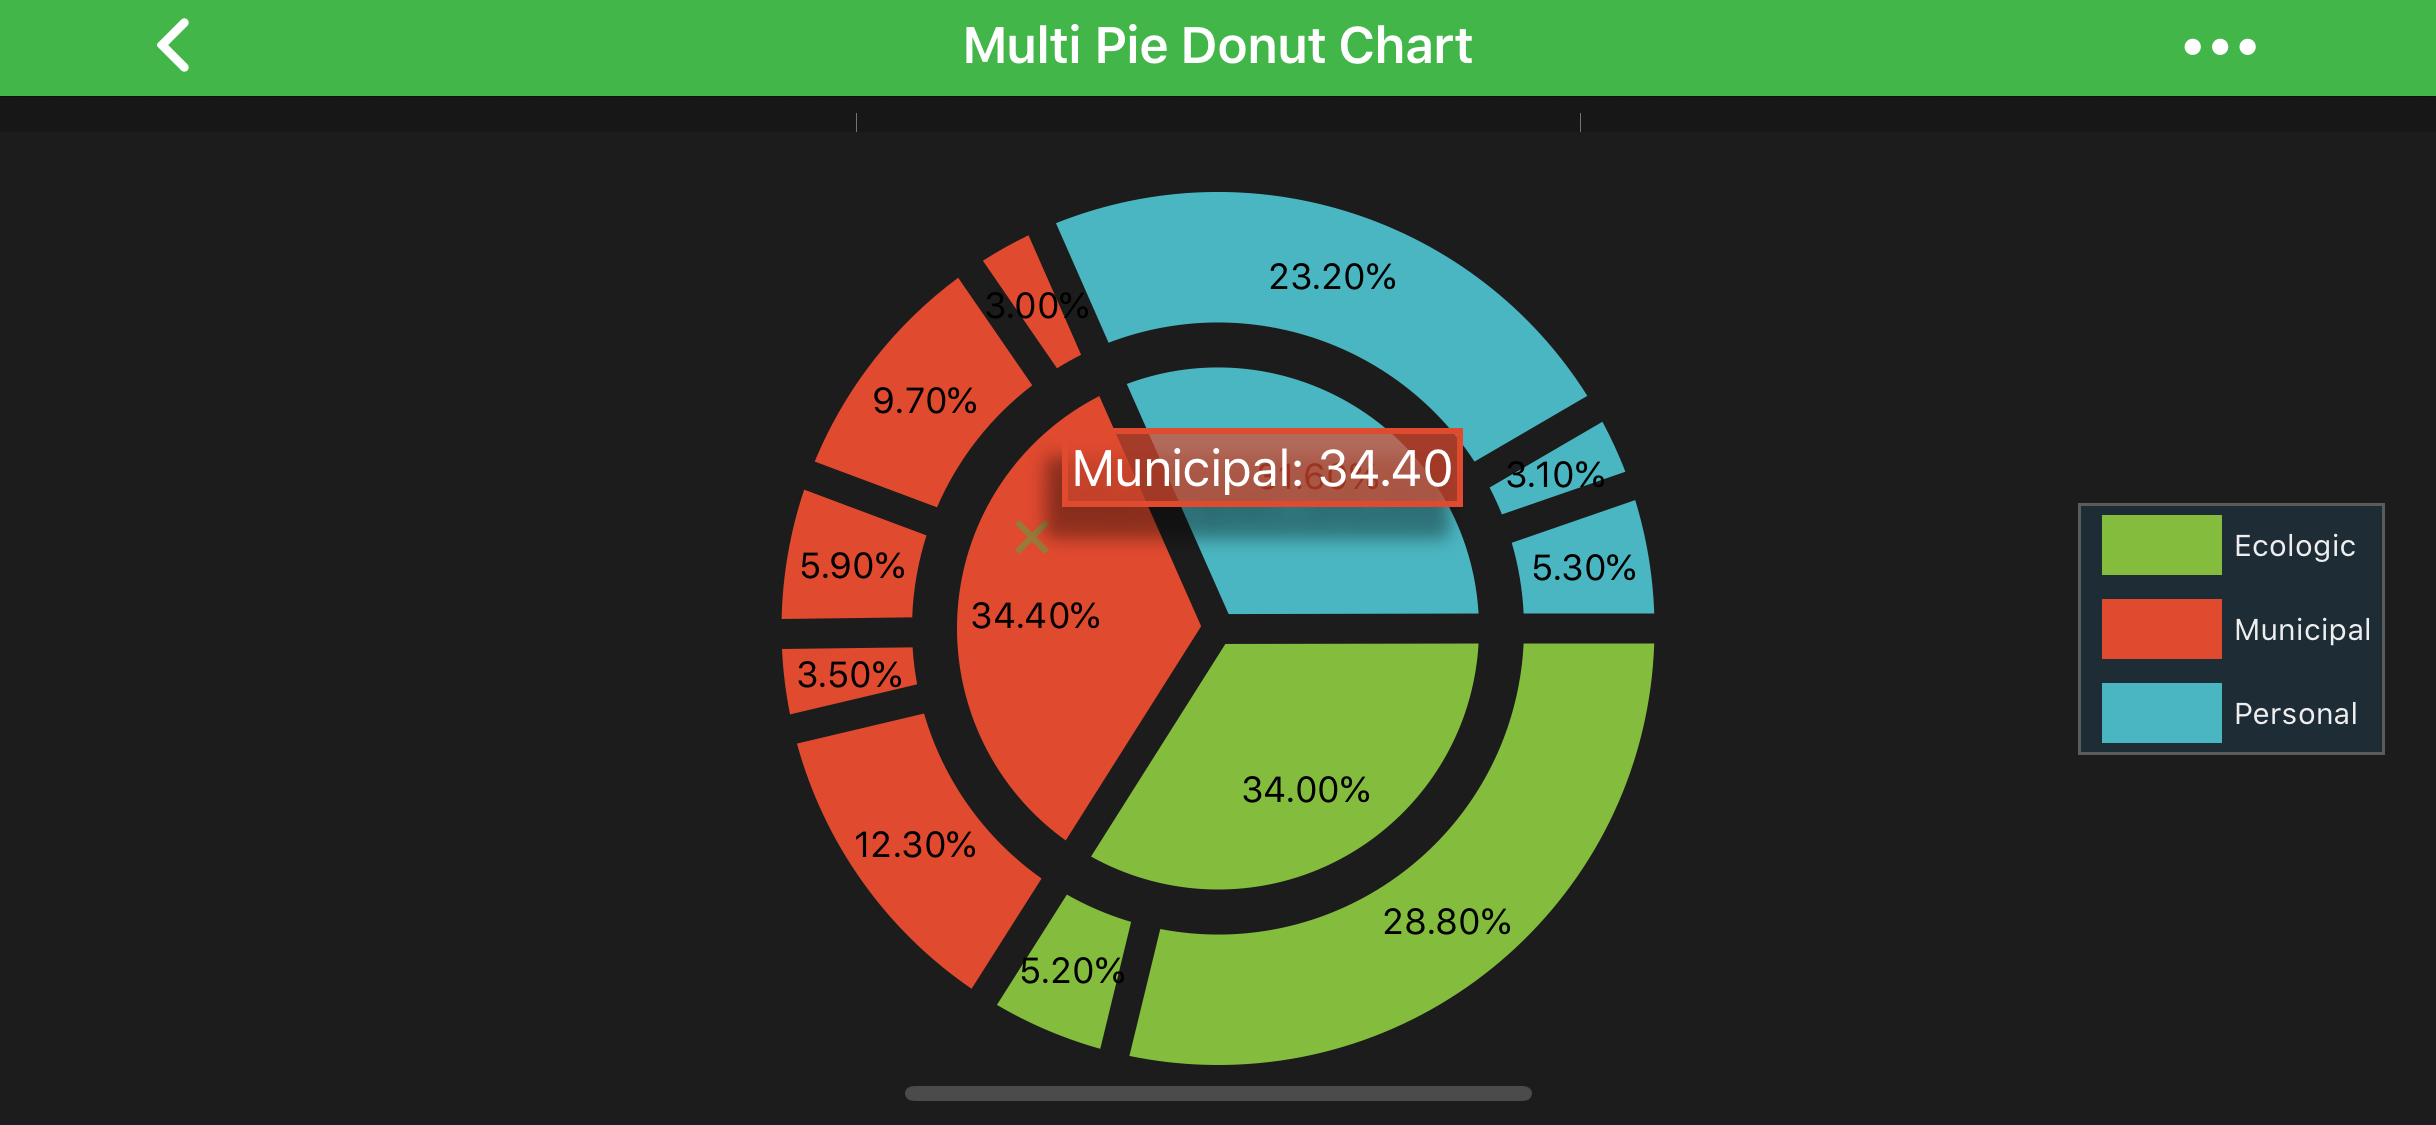
Multi Pie Donut Chart
In SciChart you can have both Pie Chart and Donut Chart placed inside the SciPieChartSurface at the same time.
Note
Examples of the Multi Pie Donut Chart can be found in the SciChart Android Examples Suite as well as on GitHub.