The Error Bars Type
In SciChart, Error Bar Series is represented by the FastErrorBarsRenderableSeries and FastFixedErrorBarsRenderableSeries types. Those accepts (X, Y, ErrorHigh, ErrorLow) data from a HlDataSeries<TX,TY> and (X, Y) data from XyDataSeries<TX,TY> respectively. Then it renders error bars above and below the Y-value.
Note
For more info about HlDataSeries<TX,TY> or XyDataSeries<TX,TY>, as well as other DataSeries types in SciChart, see the DataSeries API article.
Note
Examples for the Error Bars Series can be found in the SciChart Android Examples Suite as well as on GitHub:
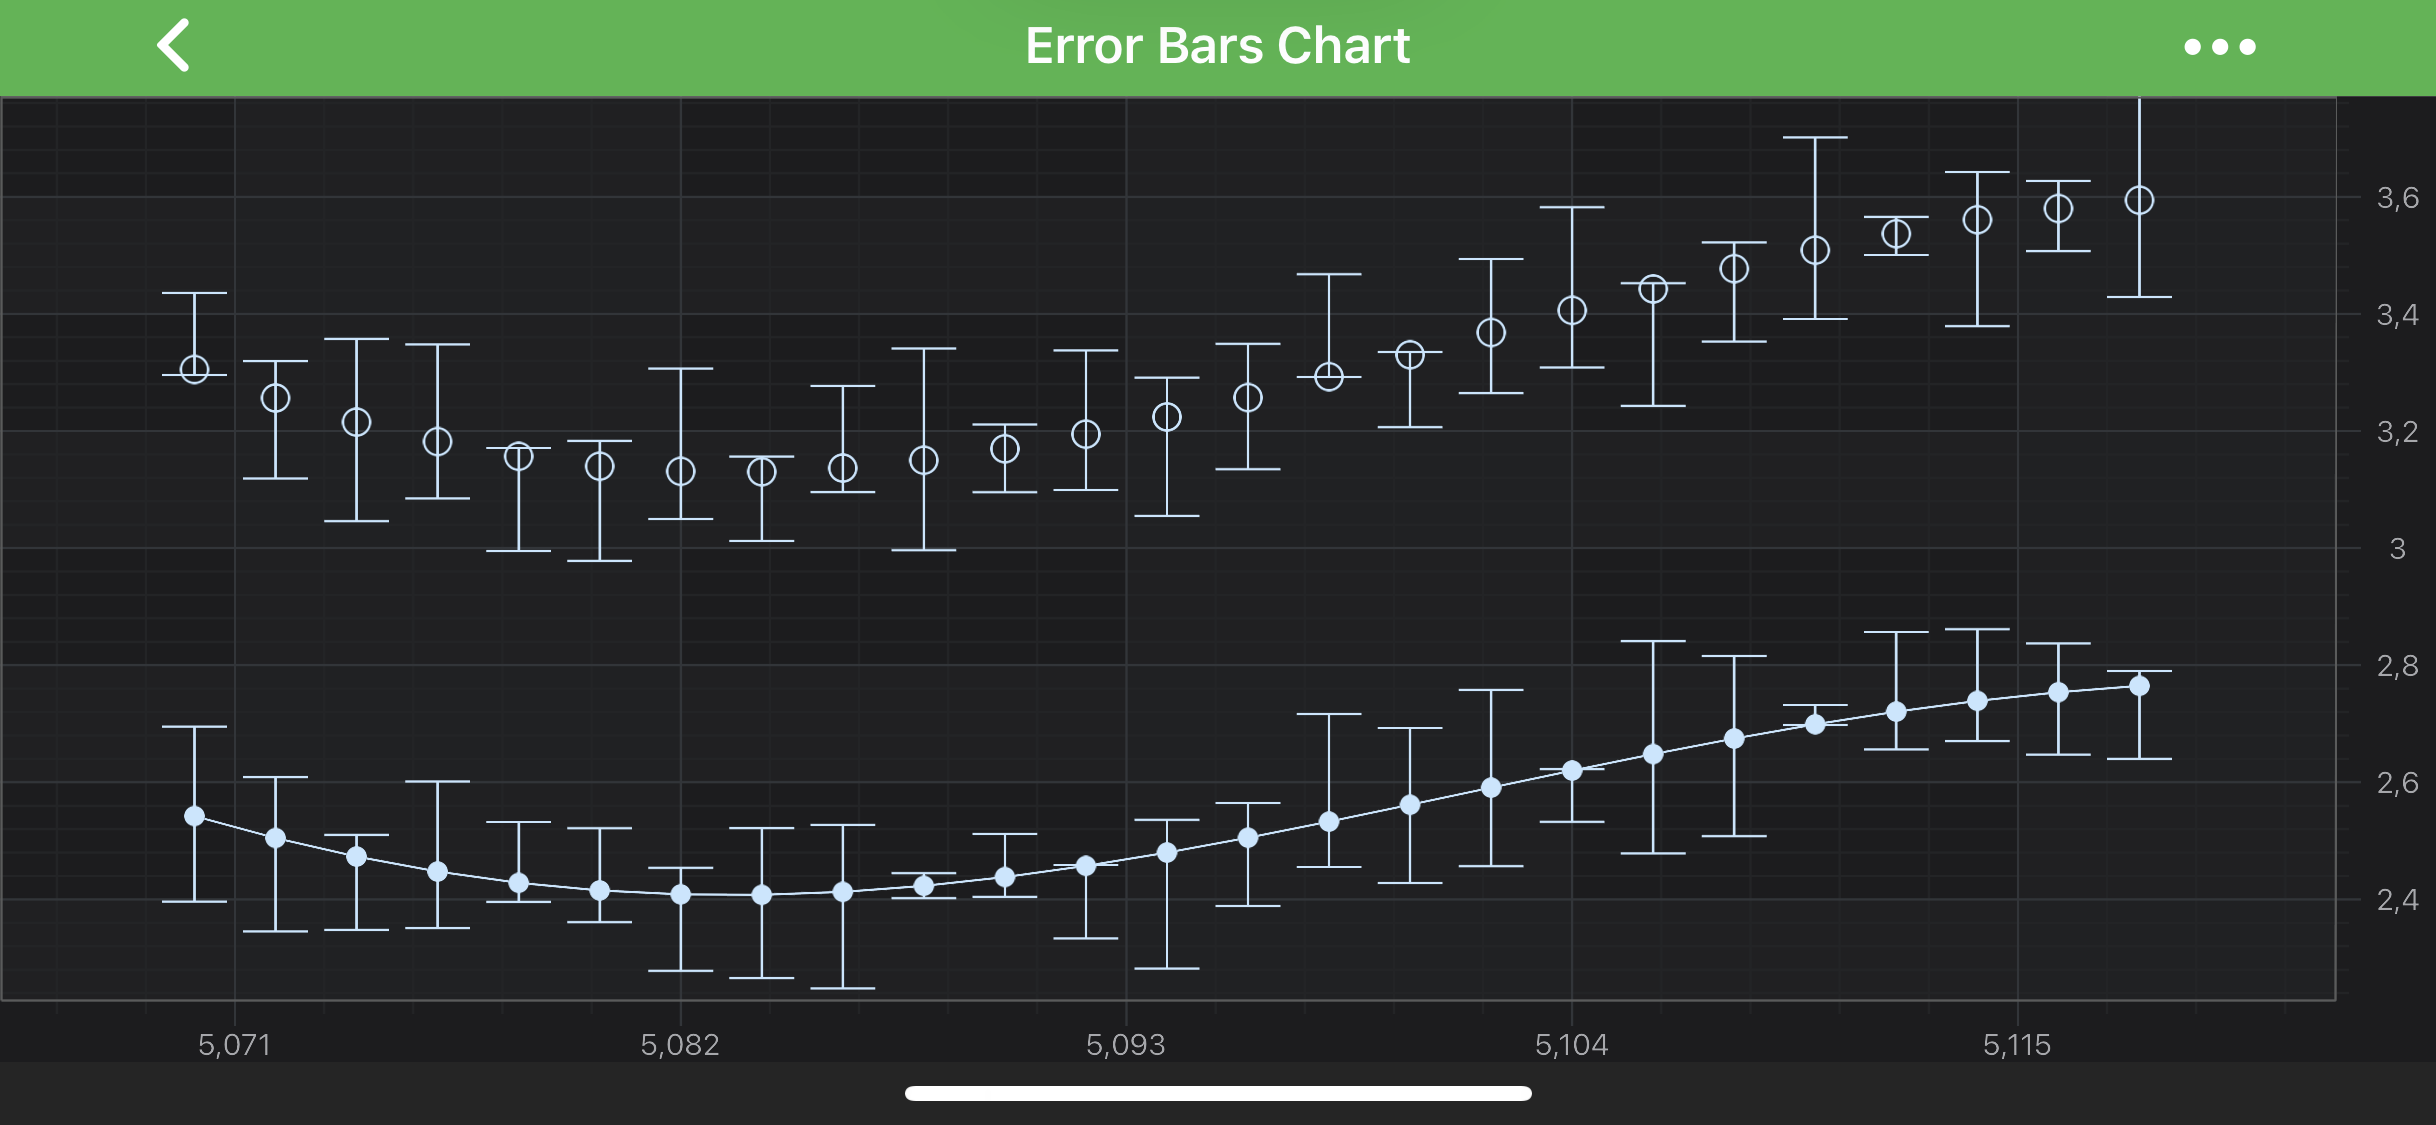
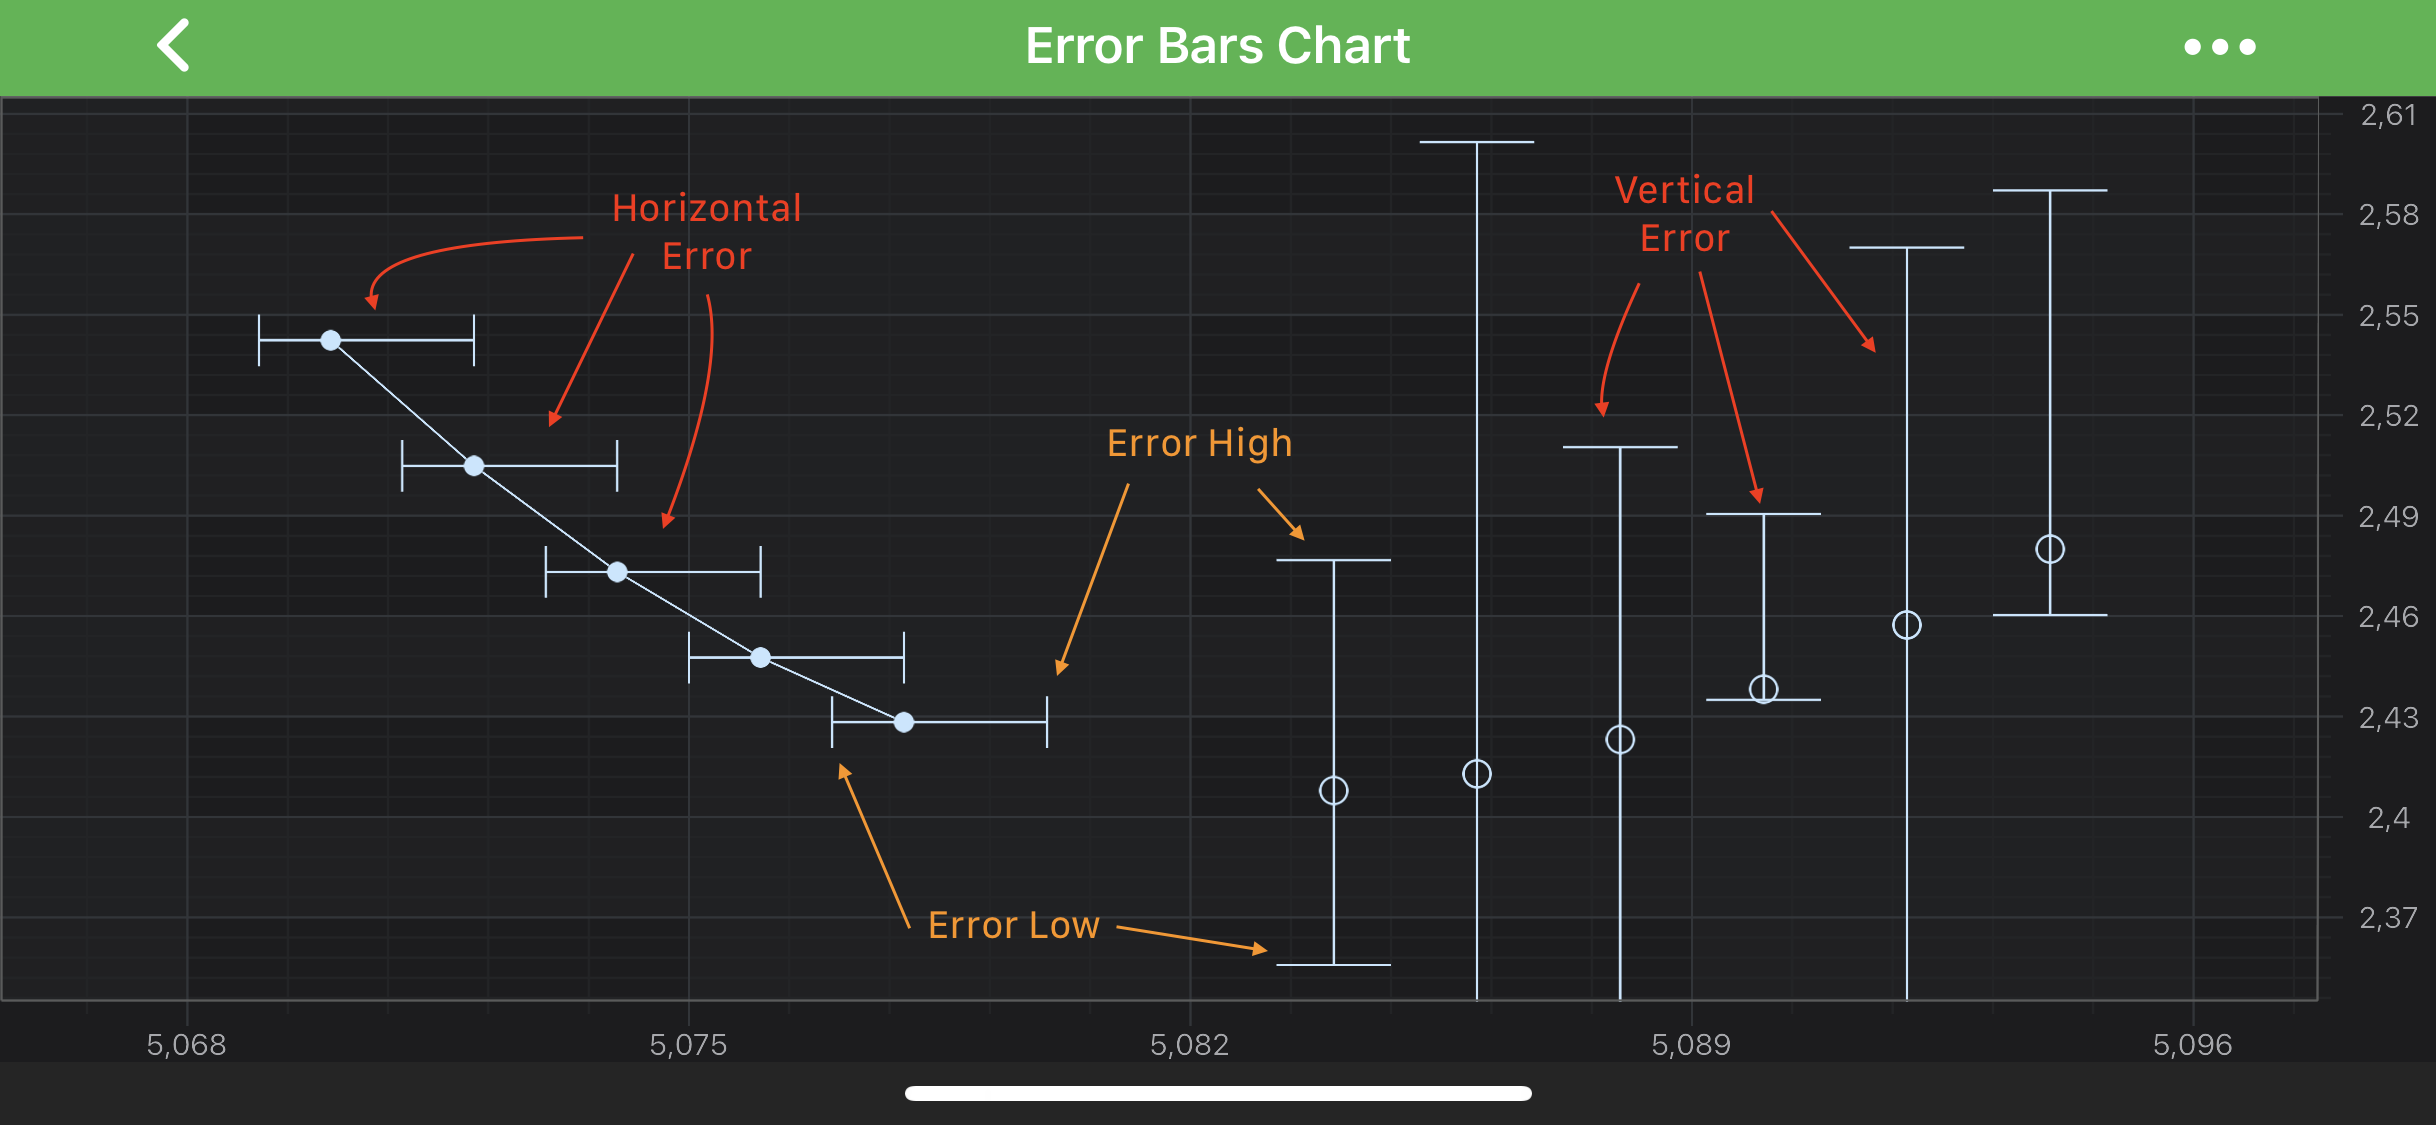
Error Bar Series allow to render error bars for every data point. There are few main properties which allow to control how Error Bars are rendered:
- errorDirection - allows rendering either Vertical or Horizontal error via the ErrorDirection enumeration.
- errorMode - choose which error to show - High, Low or Both - via the ErrorMode enumeration.
- errorType - specifies whether error value is Relative (a fraction between 0 and 1) or Absolute.
- dataPointWidth - used to determine how much space a single bar occupies. This value can vary from 0 to 1 (when bars are conjoined)
In addition to the above Error Bars can be colored differently by providing desired pens to the strokeLowStyle and strokeHighStyle properties.
Note
To learn more about Pens and Brushes and how to utilize them, please refer to the PenStyle, BrushStyle and FontStyle article.
All of the above properties are available on both - FastErrorBarsRenderableSeries and FastFixedErrorBarsRenderableSeries types.
Note
In multi axis scenarios, a series has to be assigned to particular X and Y axes. This can be done passing the axes IDs to the xAxisId, yAxisId properties.
Create an Error Bars Series
Note
This series type can be used in tandem with other series types, such as XyScatterRenderableSeries. Error Bars Series can share a DataSeries with other series, to avoid data duplication.
To Create Error Bars Series, use the following code:
@Override
protected void initExample(@NonNull SciChartSurface surface) {
    final IHlDataSeries<Double, Double> dataSeries = new HlDataSeries<>(Double.class, Double.class);
    dataSeries.append(0.0, 0.0, 0.1, 0.3);
    dataSeries.append(1.0, 1.0, 0.2, 0.2);
    dataSeries.append(2.0, 3.0, 0.3, 0.1);

    final FastErrorBarsRenderableSeries errorBarSeries = new FastErrorBarsRenderableSeries();

    errorBarSeries.setDataSeries(dataSeries);

    errorBarSeries.setStrokeStyle(new SolidPenStyle(0xFFFF1919, true, 2, null));
    errorBarSeries.setErrorMode(ErrorMode.Both);
    errorBarSeries.setErrorDirection(ErrorDirection.Vertical);

    UpdateSuspender.using(surface, () -> {
        Collections.addAll(surface.getXAxes(), new NumericAxis(requireContext()));
        Collections.addAll(surface.getYAxes(), new NumericAxis(requireContext()));

        Collections.addAll(surface.getRenderableSeries(), errorBarSeries);
    });
}
Render a Gap in a ErrorBars Series
It's possible to render a Gap in ErrorBars series, by passing a data point with a NaN as the Y value. Please refer to the RenderableSeries APIs article for more details.