Axis Layout - Central Axis
Axis Placement
SciChart supports axes plaсed inside the chart area, a.k.a in the center of the chart. This behavior is controlled by isCenterAxis. By default, isCenterAxis is set to false, and axes are drawing outside the chart. Here is the difference:
| isCenterAxis == false | isCenterAxis == true |
|---|---|
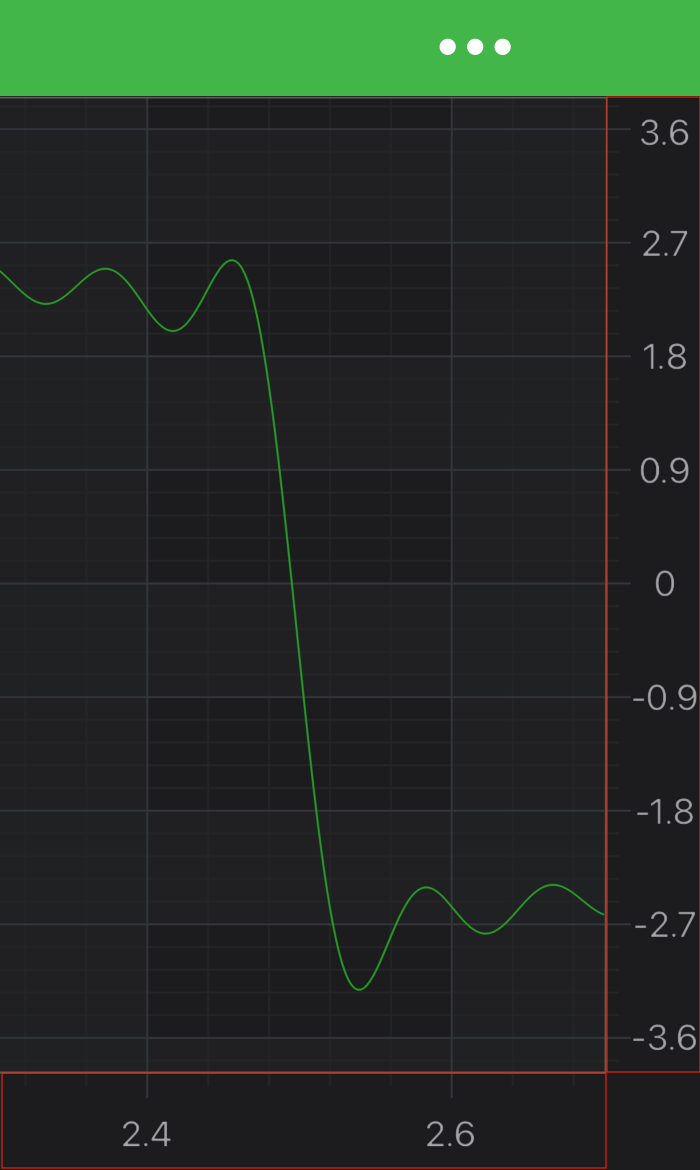 |
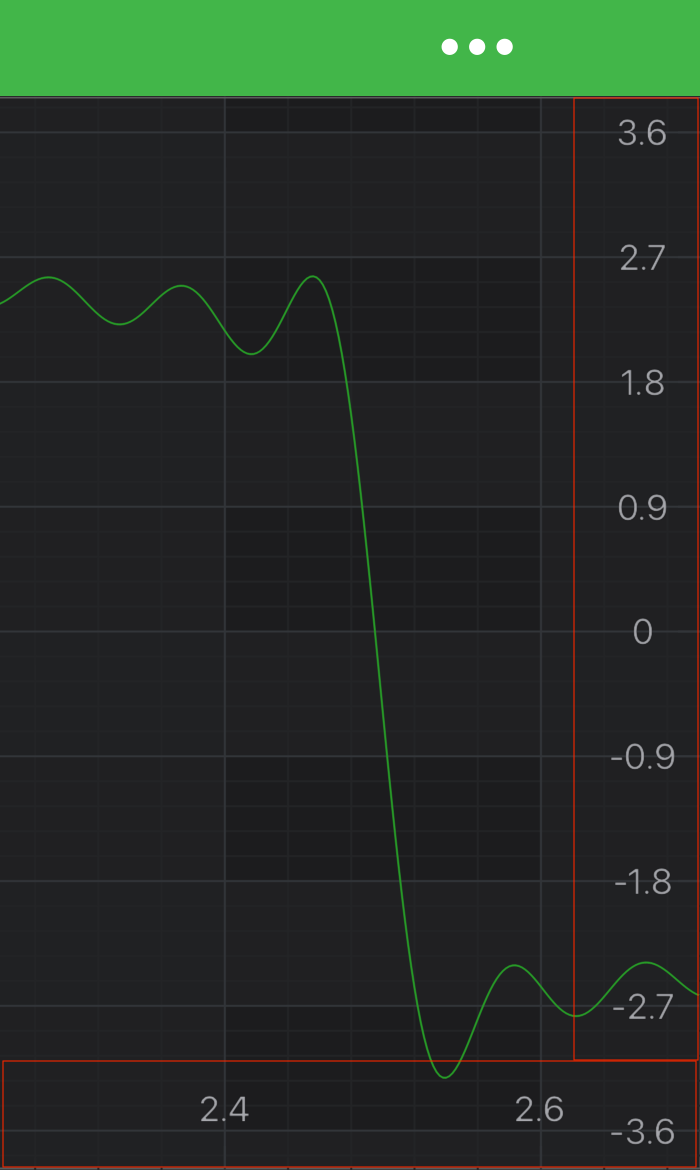 |
The above cases are quite simple, whereas you can create completely custom layouts and specify the exact axis position inside the chart area. It requires changes to the layout process in ILayoutManager. Please read on to learn how to do such an advanced layout.
The Layout System
So let's dig into layout system a little bit. There is a Default implementation of ILayoutManager - DefaultLayoutManager, and it's responsible for positioning axes on a chart.
The layout process consists of two passes for every axis, a measure pass and a layout pass. The ILayoutManager conducts this process, doing calculations and providing all the necessary data to its IAxisLayoutStrategy fields. Every AxisLayoutStrategy field handles a specific AxisAlignment case and is responsible for placing axes with corresponding Alignment inside the boundaries provided by the ILayoutManager.
The layout takes place in the onLayoutChart(int width, int height) method. It orderly calls
- measureAxes(int availableWidth, int availableHeight, layoutManagers.ChartLayoutState chartLayoutState)
- layoutAxes(int left, int top, int right, int bottom)
during the measure and layout passes and returns evaluated viewport size as the result.
The layout process is triggered by the SciChartSurface in response to different state changes. It is an essential part of a render process.
Customizing Layout of Axes
Usually you don't need to create a custom ILayoutManager, but rather to provide a custom IAxisLayoutStrategy for a specific AxisAlignment mode, e.g. for bottom axes layout or right axes layout, or both. It is possible to extend an existing IAxisLayoutStrategy class and change its behavior to better serve your purposes. Please find a list of the strategies out of the box below:
- TopAlignmentOuterAxisLayoutStrategy
- TopAlignmentInnerAxisLayoutStrategy
- BottomAlignmentOuterAxisLayoutStrategy
- BottomAlignmentInnerAxisLayoutStrategy
- LeftAlignmentOuterAxisLayoutStrategy
- LeftAlignmentInnerAxisLayoutStrategy
- RightAlignmentOuterAxisLayoutStrategy
- RightAlignmentInnerAxisLayoutStrategy
Pinned Axes
You might want to have your axis exactly at the center of the chart. Let's say the X-Axis. To do just that, we can extend the TopAlignmentOuterAxisLayoutStrategy class (or any suitable horizontal strategy) and make the stack of the top-aligned X axes to start exactly at the center of a chart. Let's try to build that and apply the newly created layout strategy to a topInnerAxesLayoutStrategy and then - to the SciChartSurface:
class CenteredAxisLayoutStrategy extends TopAlignmentInnerAxisLayoutStrategy {
    private int chartAreaWidth, chartAreaHeight;
    @Override
    public void measureAxes(int availableWidth, int availableHeight, ChartLayoutState chartLayoutState) {
        super.measureAxes(availableWidth, availableHeight, chartLayoutState);

        chartAreaWidth = availableWidth;
        chartAreaHeight = availableHeight;
    }

    @Override
    public void layoutAxes(int left, int top, int right, int bottom) {

        // pin the stack of the top-aligned X Axes to the center of a chart
        final int topCoord = chartAreaHeight/2;

        layoutFromTopToBottom(left, topCoord, right, axes);
    }
}
final NumericAxis xAxis = new NumericAxis(getContext());
// Set place axis appropriately for "Top-Inner" Axis Strategy
xAxis.setIsCenterAxis(true);
xAxis.setAxisAlignment(AxisAlignment.Top);

// Create and set new Layout Strategy
final DefaultLayoutManager layoutManager = new DefaultLayoutManager.Builder()
        .setTopInnerAxesLayoutStrategy(new CenteredAxisLayoutStrategy())
        .build();
surface.setLayoutManager(layoutManager);
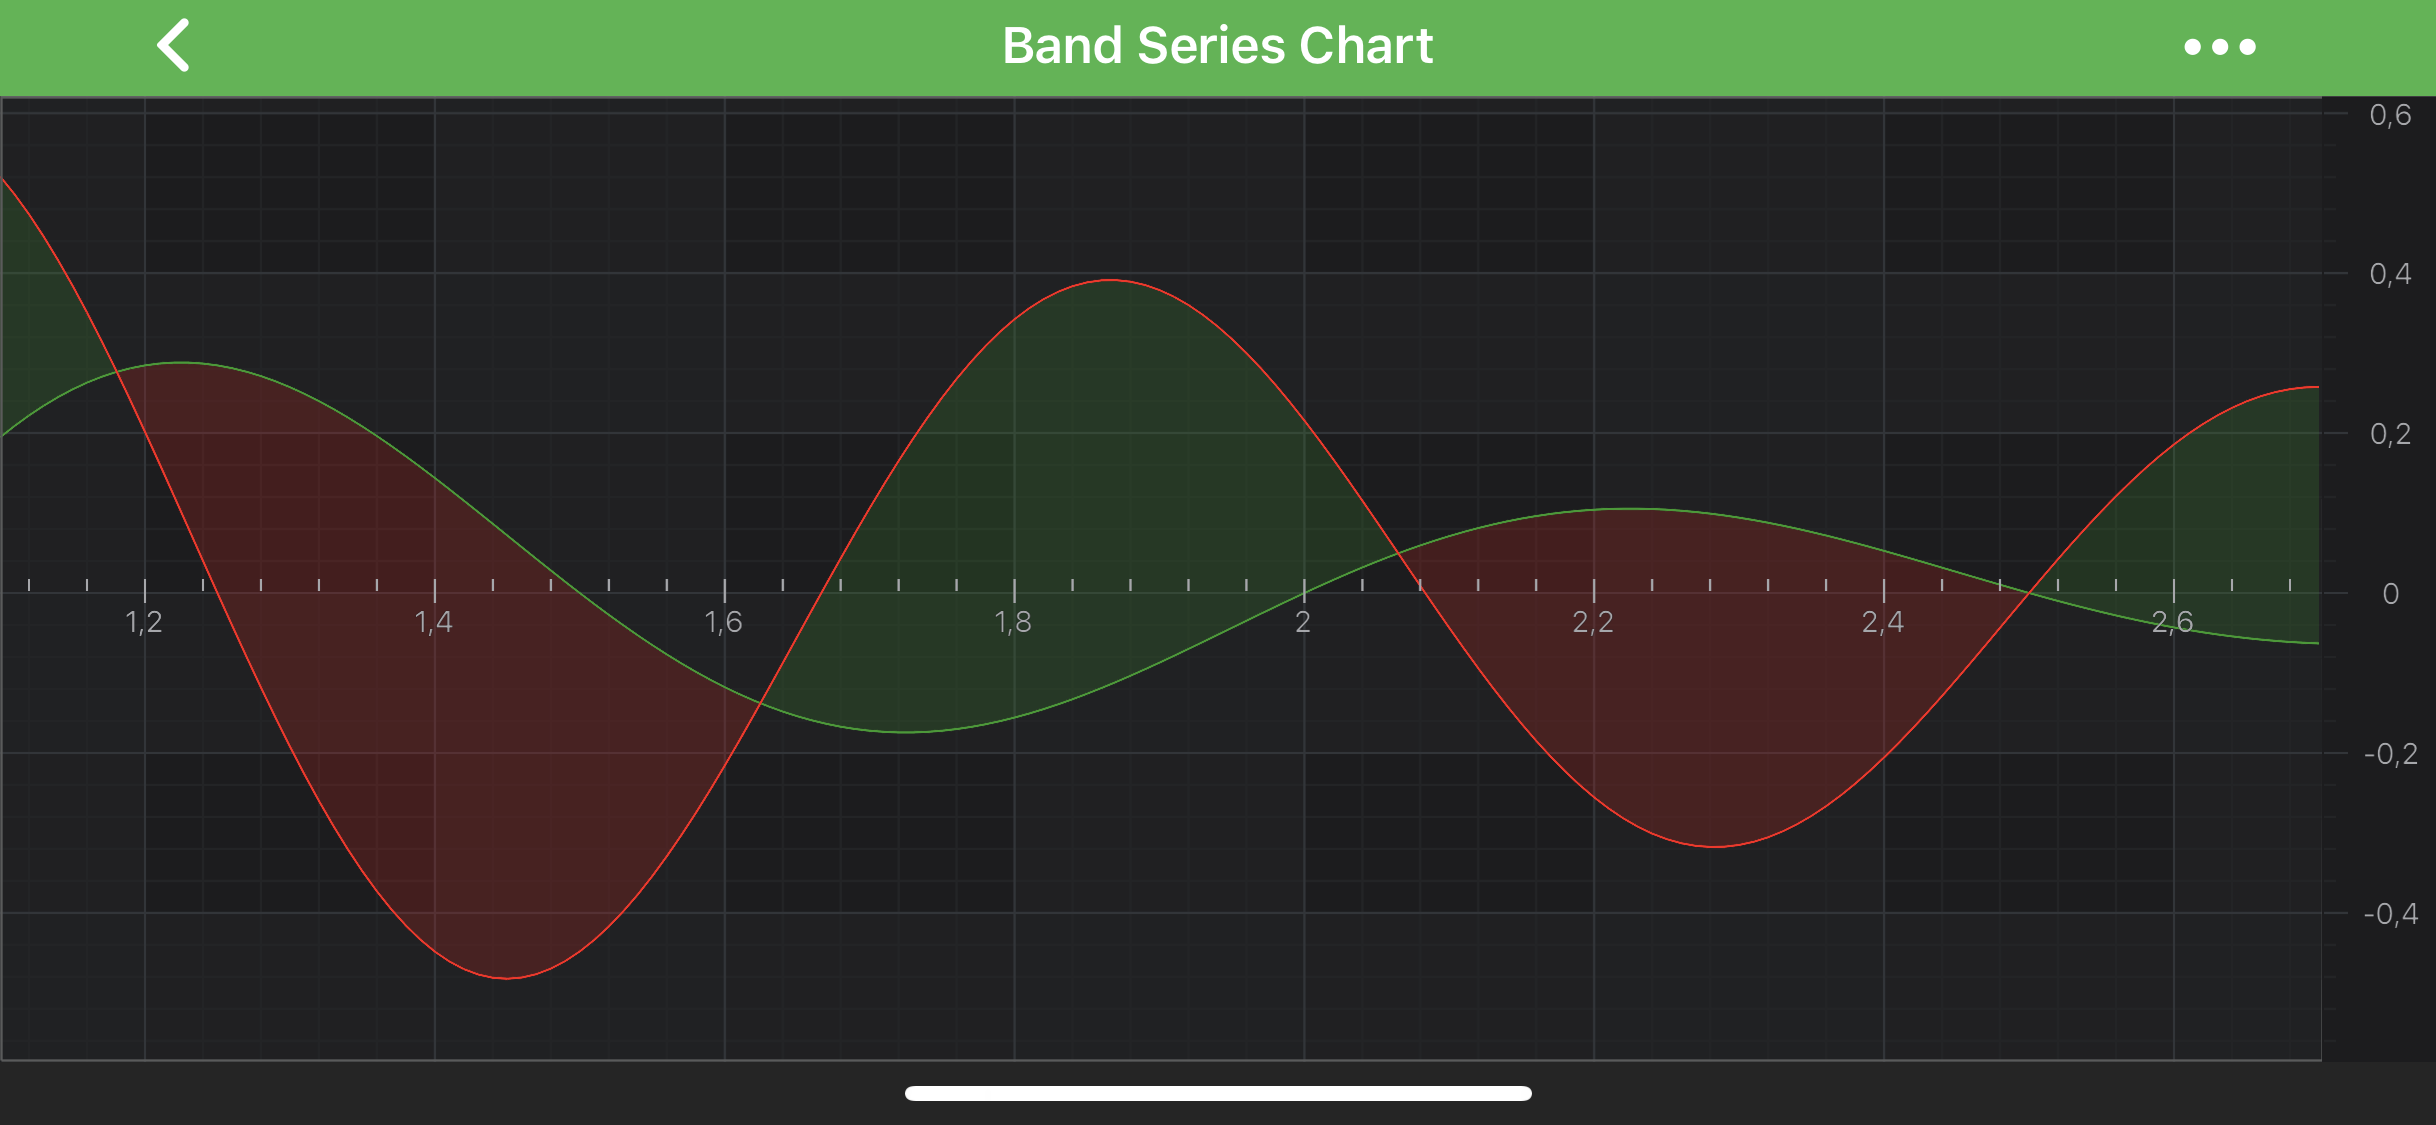
As the result, the X Axis should be placed at the center of a chart. It should look very similar to this:
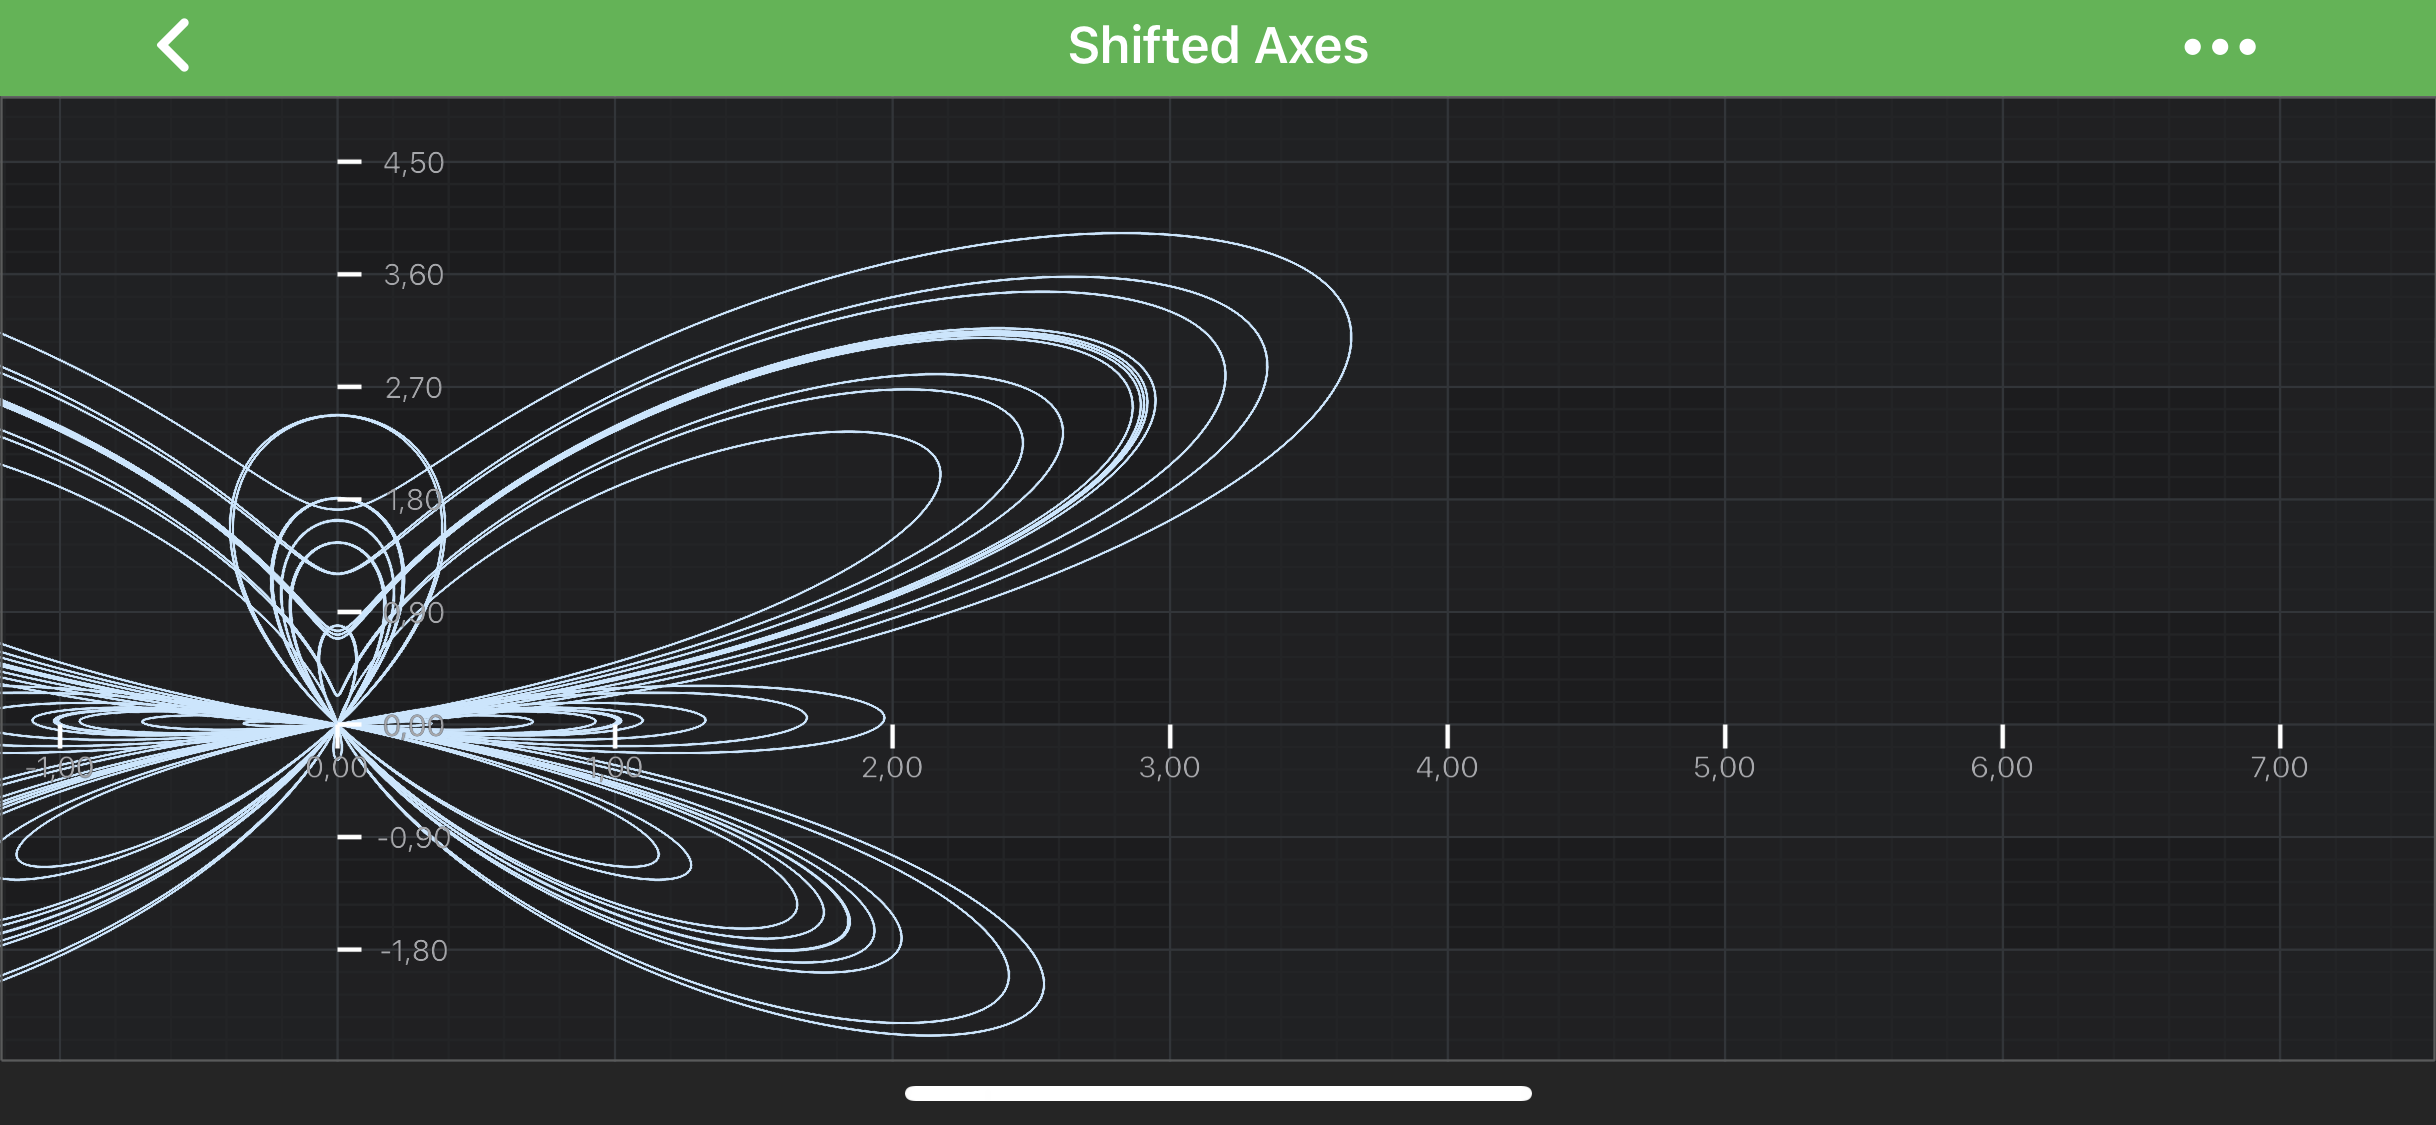
Floating Axes
Another possible scenario, floating axes, can be found in the example called Central X Axis and Y Axis from the SciChart Android Example Suite.
In this case each axis is pinned to 0 value of the other axis. To achieve this, the pixel coordinate of the 0 data value is looked for during every layout pass, using the Coordinate Transformation API:
class CenteredTopAlignmentAxisLayoutStrategy extends TopAlignmentOuterAxisLayoutStrategy {
    private final IAxis yAxis;
    private CenteredTopAlignmentAxisLayoutStrategy(IAxis yAxis) {
        this.yAxis = yAxis;
    }

    @Override
    public void layoutAxes(int left, int top, int right, int bottom) {

        // find the coordinate of 0 on the Y Axis in pixels
        // place the stack of the top-aligned X Axes at this coordinate
        final float topCoord = yAxis.getCurrentCoordinateCalculator().getCoordinate(0);
        layoutFromTopToBottom(left, (int) topCoord, right, axes);
    }
}
As it can be seen in the example, both axes are pinned to a given data value, not to a specific position inside the chart area. Thus they will adjust their positions accordingly to VisibleRange changes. Please refer to the Central X Axis and Y Axis Example to find the complete code sample.
For more examples of custom axes layouts, please refer to the Stack Axes Vertically or Horizontally article.
Advanced Axes Layout Customization
For more advanced layout customization it is possible to override the whole layout process. To achieve this, a custom ILayoutManager is required with a custom layout process implemented in the onLayoutChart(int width, int height) method.