Axis Ticks - MajorDelta, MinorDelta and AutoTicks
Axis Ticks, Labels and Grid Lines
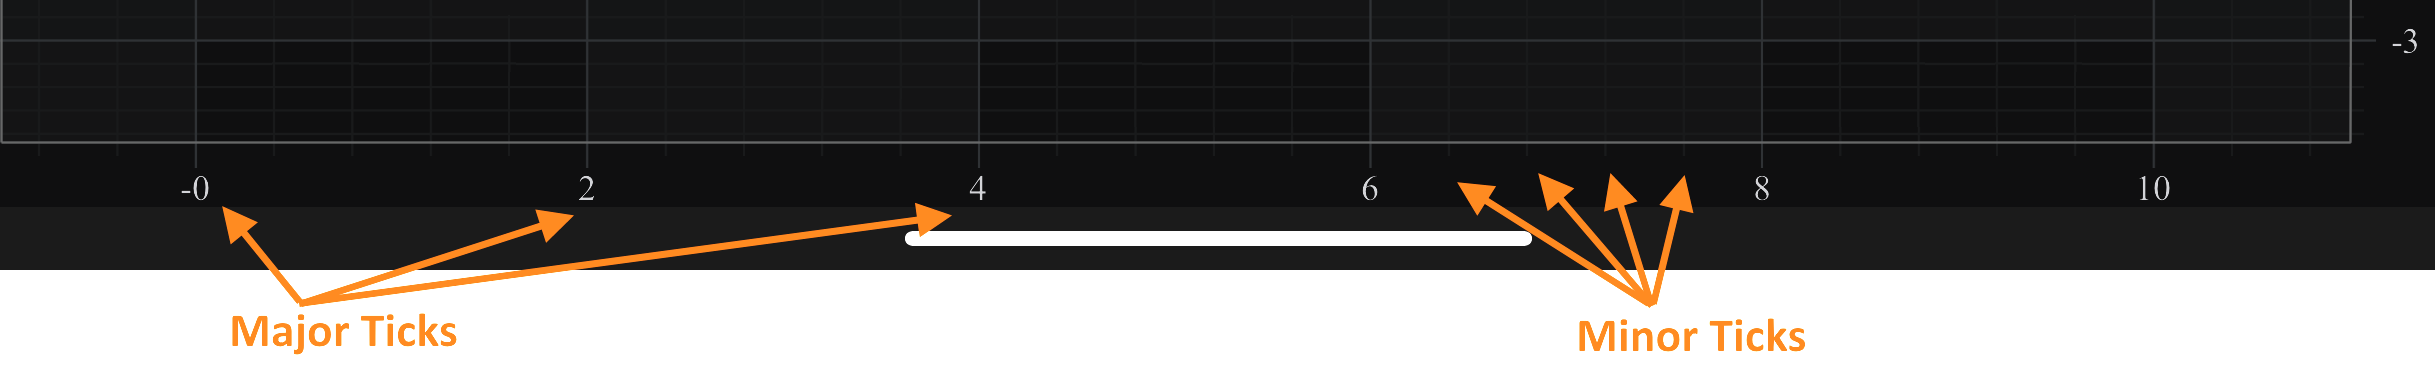
In SciChart, the Ticks are small marks around the chart on an axis. There are Minor and Major Ticks, where Minor Ticks are placed in between Major ones. By default, Major Ticks are longer and thicker than Minor Ticks.
Axis Labels appears for every Major Tick, if there is enough space around. If Axis Labels are placed too tightly, some of them get culled to make more space. If necessary, labels culling can be switched off via isLabelCullingEnabled property.
Grid Lines correspond to Ticks on an axis. Likewise, there are Minor and Major Grid lines. In SciChart, axes are responsible not only for drawing Ticks and Labels, but also for the chart grid. An axis draws only those Grid Lines that can be measured against it, i.e. a horizontal axis draws vertical grid lines and vice versa.
To learn more about possible options for Axis Ticks, Gridlines and Labels, please refer to the Axis Styling - Grid Lines, Ticks and Axis Bands and Axis Styling - Title and Labels articles.
Automatic Tick Spacing
In SciChart, the difference between two Major Ticks is called MajorDelta, and that between two minor Ticks - MinorDelta. By default, both delta values, and therefore the Tick spacing, are calculated automatically according to the VisibleRange and size of an axis. As zoom level changes, the majorDelta, minorDelta of every axis will be updated correspondingly, and the tick frequency may change.
There are two additional options used to control the auto ticking behavior. The maxAutoTicks property allows to limit the number of generated ticks to the desired number, and the minorsPerMajor - specifies how many Minor Ticks are drawn between two Major Ticks (the default is 5).
final NumericAxis axis = new NumericAxis(getContext());
// change max possible auto ticks amount (the default is 10)
axis.setMaxAutoTicks(20);
// specify that there should be 10 Minor Ticks between two Major Ticks (the default is 5)
axis.setMinorsPerMajor(10);
Altering Tick Spacing
It is also possible to set MinorDelta and MajorDelta manually. To change them, automatic calculation must be switched off via the autoTicks property. To set delta values, call the minorDelta and majorDelta properties. Please note that both delta values need to be set in this case:
final NumericAxis axis = new NumericAxis(getContext());
axis.setAutoTicks(false);
axis.setMinorDelta(2);
axis.setMajorDelta(10);
Altering Tick Spacing for the Logarithmic Axis
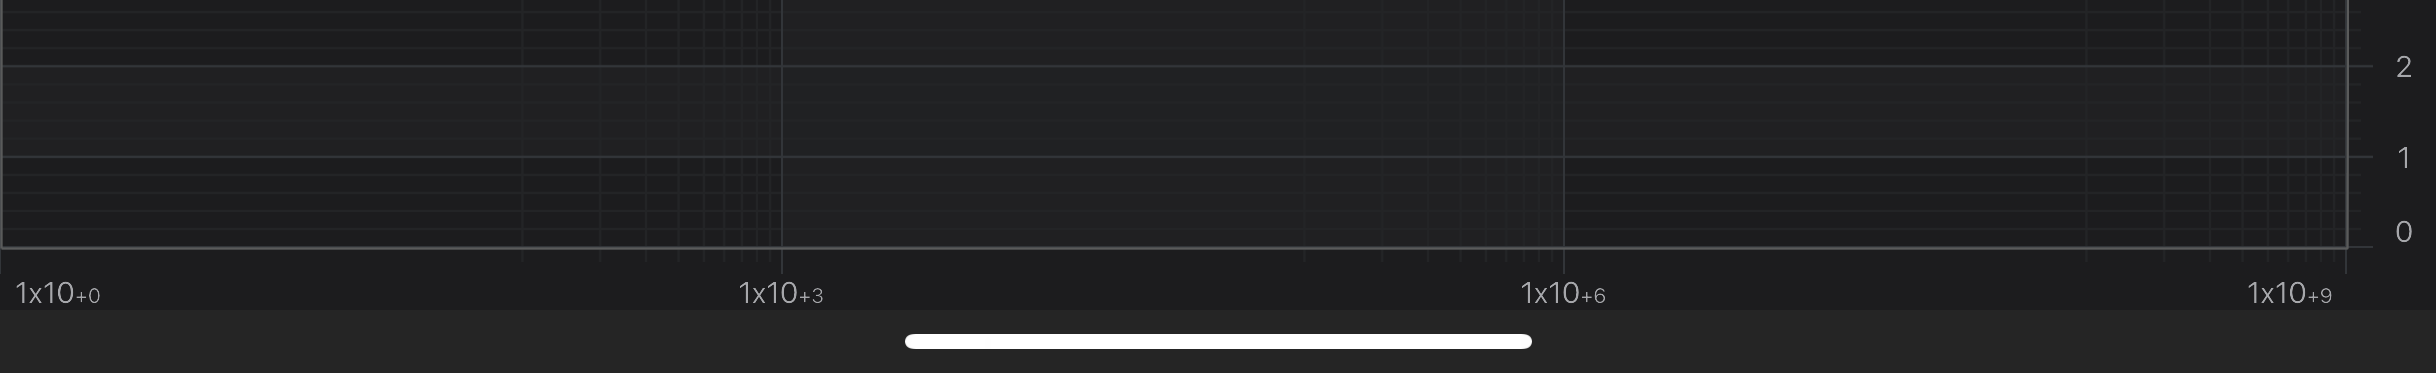
LogarithmicNumericAxis is a special case that need to be mentioning here. Due to the exponential nature of this axis type, MajorDelta represents the difference between exponents of neighbouring major ticks, not between their actual values. For instance, having majorDelta = 3 and logarithmicBase = 10 on a LogarithmicNumericAxis specifies that major ticks and gridlines will be spaced at 103 intervals (exponents will be divisors of MajorDelta):
On the contrary, the difference between neighbouring minor ticks is not exponential. Therefore, MinorDelta represents the difference between the actual values of neighbouring minor ticks.
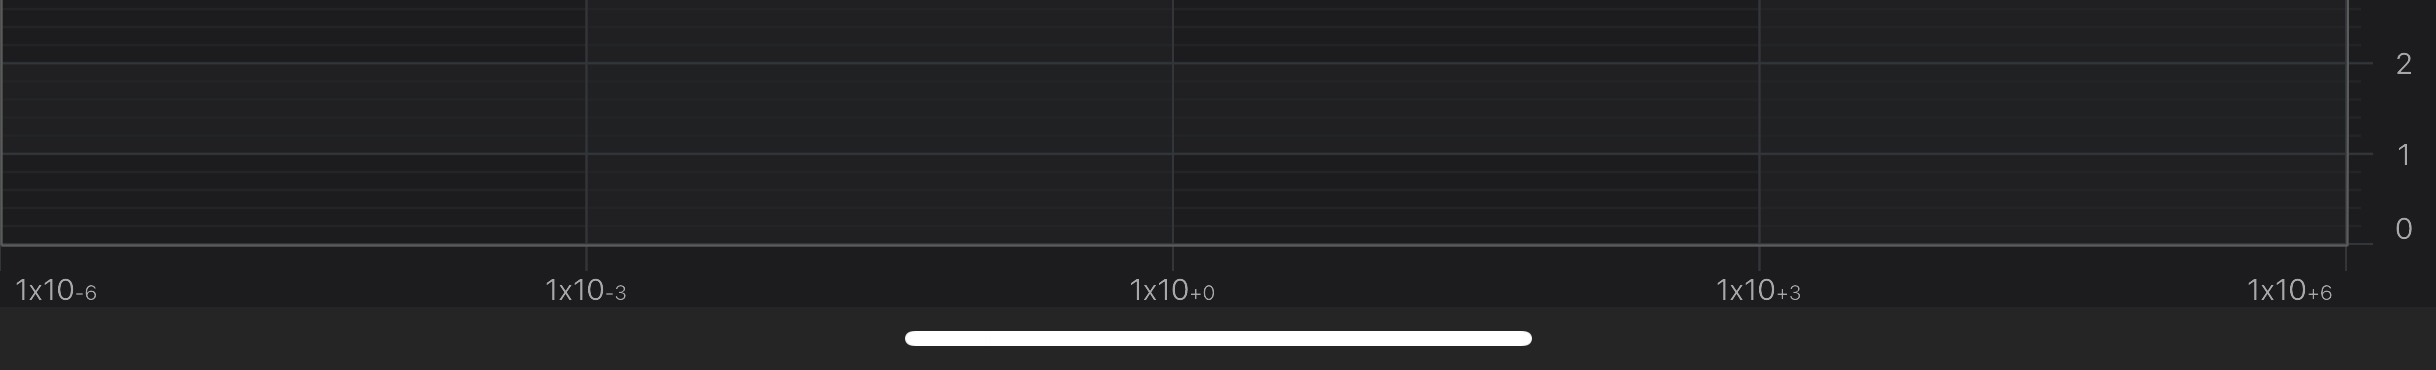
For instance, having minorDelta = 100 results in minor ticks and gridlines appearing with the increment of 100x10E, where E is the exponent of the nearest major tick to the left. So, the interval will be like the following:
| Range | Interval | Raw Interval |
|---|---|---|
| [1x100, 1x10³] | 100x100 | 100 |
| [1x10³, 1x10⁶] | 100x103 | 100000 |
| [1x10⁶, 1x10⁹] | 100x106 | 100000000 |