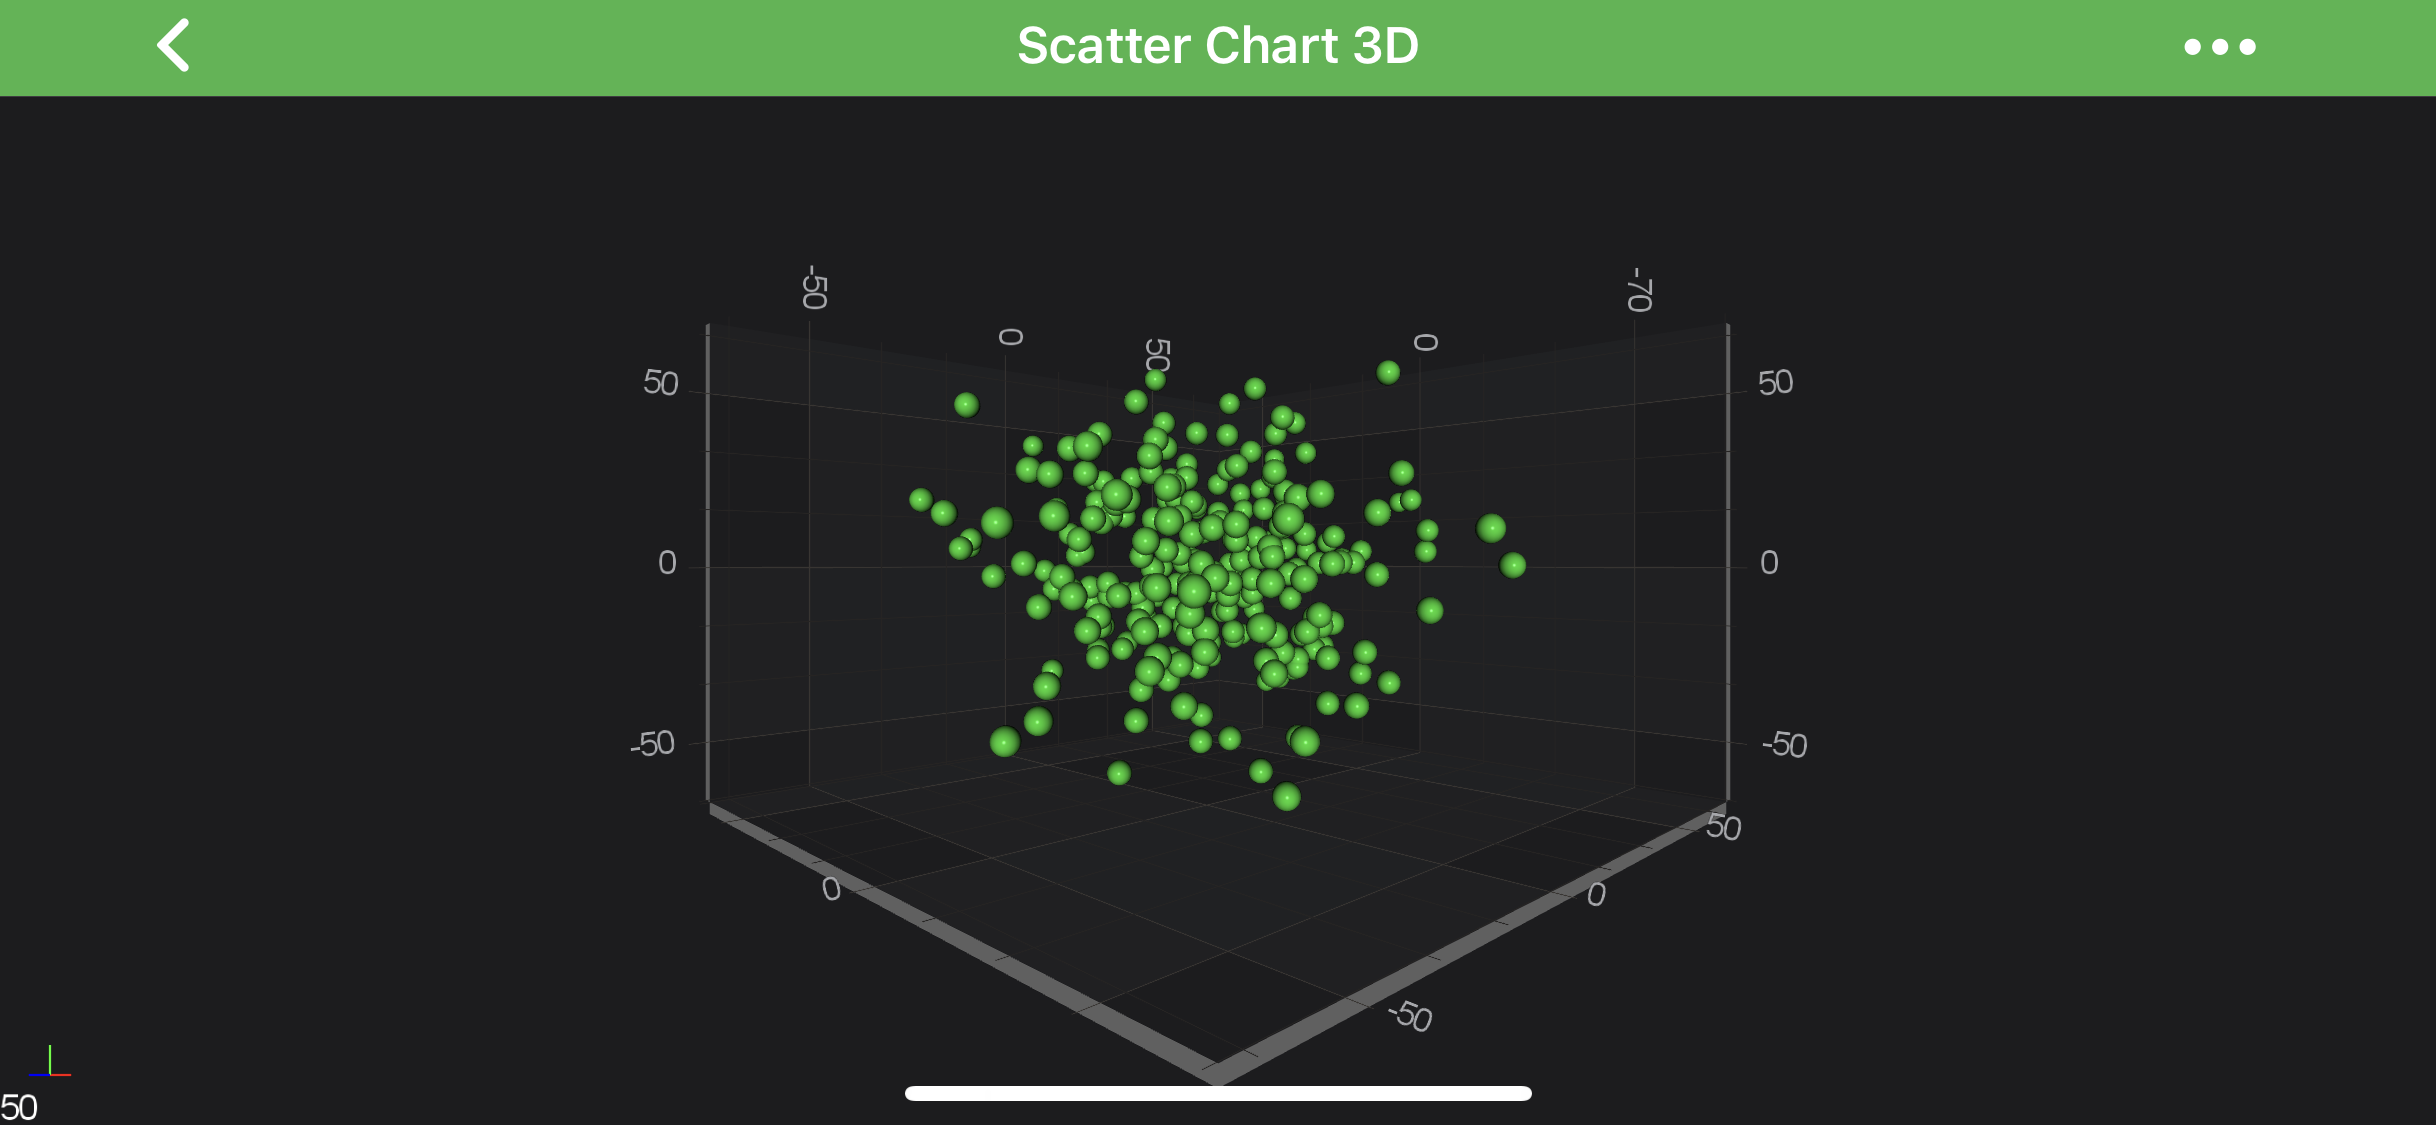
The Scatter 3D Chart Type
3D Scatter Charts can be created using the ScatterRenderableSeries3D type.
Note
Examples for the Scatter Series 3D can be found in the SciChart Android Examples Suite as well as on GitHub:
The Scatter Series 3D requires a shape to be specified using the Point Markers 3D. SciChart provides several shapes out of the box:
| Flat-Texture PointMarkers | Mesh (Volumetric) PointMarkers |
|---|---|
| TrianglePointerMarker3D | PyramidPointMarker3D |
| QuadPointMarker3D | CubePointMarker3D |
| EllipsePointMarker3D | SpherePointMarker3D |
| PixelPointMarker3D | CylinderPointMarker3D |
| CustomPointMarker3D |
It is also possible to define custom texture for the Point Markers via the CustomPointMarker3D. Please refer to the PointMarkers 3D API article to learn more. You can also override colors of the Point Markers 3D individually using The MetadataProvider API.
Create a 3D Scatter Series
To create a ScatterRenderableSeries3D, use the following code:
final NumericAxis3D xAxis = new NumericAxis3D();
xAxis.setGrowBy(new DoubleRange(.1, .1));

final NumericAxis3D yAxis = new NumericAxis3D();
yAxis.setGrowBy(new DoubleRange(.1, .1));

final NumericAxis3D zAxis = new NumericAxis3D();
zAxis.setGrowBy(new DoubleRange(.1, .1));

final XyzDataSeries3D<Double, Double, Double> ds = new XyzDataSeries3D<>(Double.class, Double.class, Double.class);
for (int i = 0; i < 250; i++) {
    final double x = dataManager.getGaussianRandomNumber(15, 1.5);
    final double y = dataManager.getGaussianRandomNumber(15, 1.5);
    final double z = dataManager.getGaussianRandomNumber(15, 1.5);
    ds.append(x, y, z);
}

final SpherePointMarker3D pointMarker = new SpherePointMarker3D();
pointMarker.setSize(10);
pointMarker.setFill(0xFF32CD32);

final ScatterRenderableSeries3D rs = new ScatterRenderableSeries3D();
rs.setDataSeries(ds);
rs.setPointMarker(pointMarker);

UpdateSuspender.using(surface, () -> {
    surface.setXAxis(xAxis);
    surface.setYAxis(yAxis);
    surface.setZAxis(zAxis);
    surface.getRenderableSeries().add(rs);
    surface.getChartModifiers().add(createDefaultModifiers3D());
});
In the code above, a Scatter Series instance is created and assigned to draw the data provided by the IDataSeries3D<TX,TY,TZ> assigned to it. The Scatters 3D are drawn with a PointMarker provided by the SpherePointMarker3D instance. Finally, the 3D Scatter Series is added to the getRenderableSeries() collection.
Paint Scatters With Different Colors
Is SciChart, you can draw each scatter of the Scatter Series 3D with the different color using the MetadataProvider API. To use MetadataProvider for scatters 3D - a custom IPointMetadataProvider3D has to be provided to the metadataProvider property. Also, there is PointMetadataProvider3D provided out of the box, as a general case for Scatter Series 3D.
Individually colored Scatter Series 3D are also known as Bubble 3D Chart. Please visit the corresponding article for more information about it.
Note
To learn more about coloring IRenderableSeries3D points individually - refer to the MetadataProvider API article for more info.