PointMarker 3D API
SciChart features a rich PointMarkers 3D API to annotate the data-points of certain 3D series with markers, e.g. Pyramid, Sphere, Ellipse, Quad or even a Custom Shape marker. Some series types, such as Scatter RenderableSeries 3D or Impulse RenderableSeries 3D, require a PointMarker3D assigned to them unless they won't render at all.
This article is about how to configure and add PointMarkers 3D to a IRenderableSeries3D to render markers for every data point.
Note
Examples of Using PointMarkers API can be found in the SciChart Android Examples Suite as well as on GitHub:
PointMarker 3D Types
SciChart provides several PointMarker 3D shapes out of the box, which are of 2 types: Flat-Texture and Mesh (Volumetric) which can be found below:
| Flat-Texture PointMarkers | Mesh (Volumetric) PointMarkers |
|---|---|
| TrianglePointerMarker3D | PyramidPointMarker3D |
| QuadPointMarker3D | CubePointMarker3D |
| EllipsePointMarker3D | SpherePointMarker3D |
| PixelPointMarker3D | CylinderPointMarker3D |
| CustomPointMarker3D |
It is possible to have a custom Flat-Texture PointMarker, and there is a CustomPointMarker3D for such purpose. It allows to render a point marker from a Bitmap. For more details, refer to the Custom PointMarkers 3D section down the page.
All the PointMarker types are inherited from the BasePointMarker3D, which provides the following properties for styling point markers:
| PointMarker property | Description |
|---|---|
| size | Allows to specify the size of a PointMarker. PointMarkers will not appear if this value isn't set. |
| fill | Specifies the fill color which will be used while drawing the PointMarker instance. |
| markerType | Defines the MarkerType for this point marker. |
Using PointMarkers 3D
Code for creation and assigning a PointMarker 3D to a IRenderableSeries3D is essentially the same regardless of a PointMarker type. After an instance of it has been created, it can be configured and then applied to the pointMarker property:
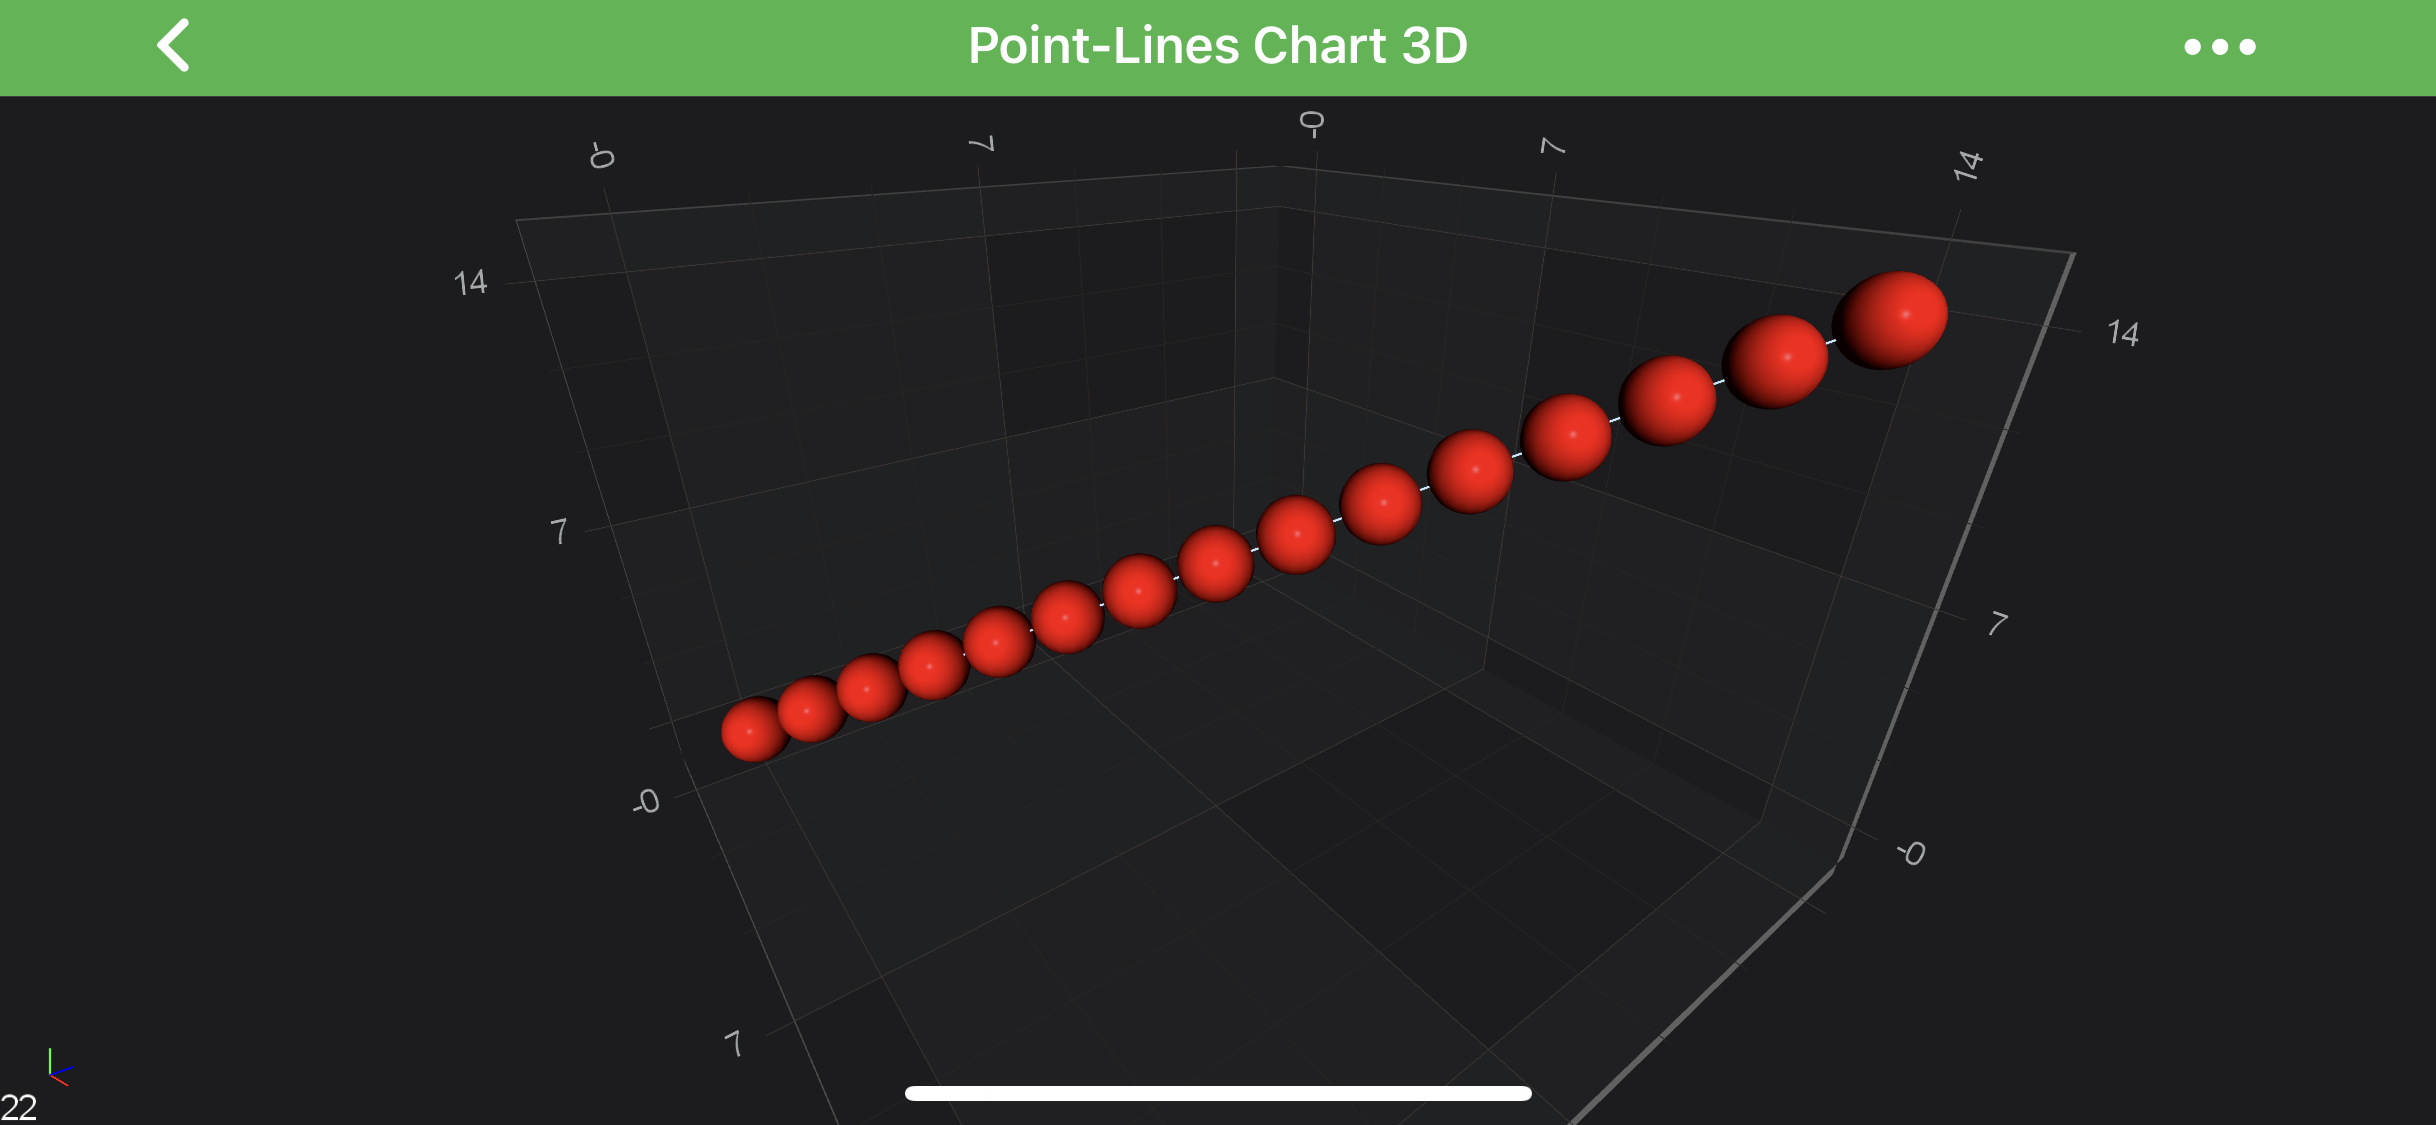
// Create a Sphere PointMarker 3D instance
final SpherePointMarker3D pointMarker = new SpherePointMarker3D();
pointMarker.setSize(25);
pointMarker.setFill(0xFFFF0000);

// Apply the PointMarker to a PointLine Series 3D
final PointLineRenderableSeries3D rs = new PointLineRenderableSeries3D();
rs.setPointMarker(pointMarker);
The code above will produce the following chart (assuming that the data has been added to the PointLine Series):
Custom PointMarkers 3D
SciChart Android 3D provides a possibility to draw custom Flat-Texture PointMarkers via the CustomPointMarker3D class. All you need to do - is to provide Bitmap texture which will be used as sprite, and then - rendered onto a 3d world.
Please see the example below:
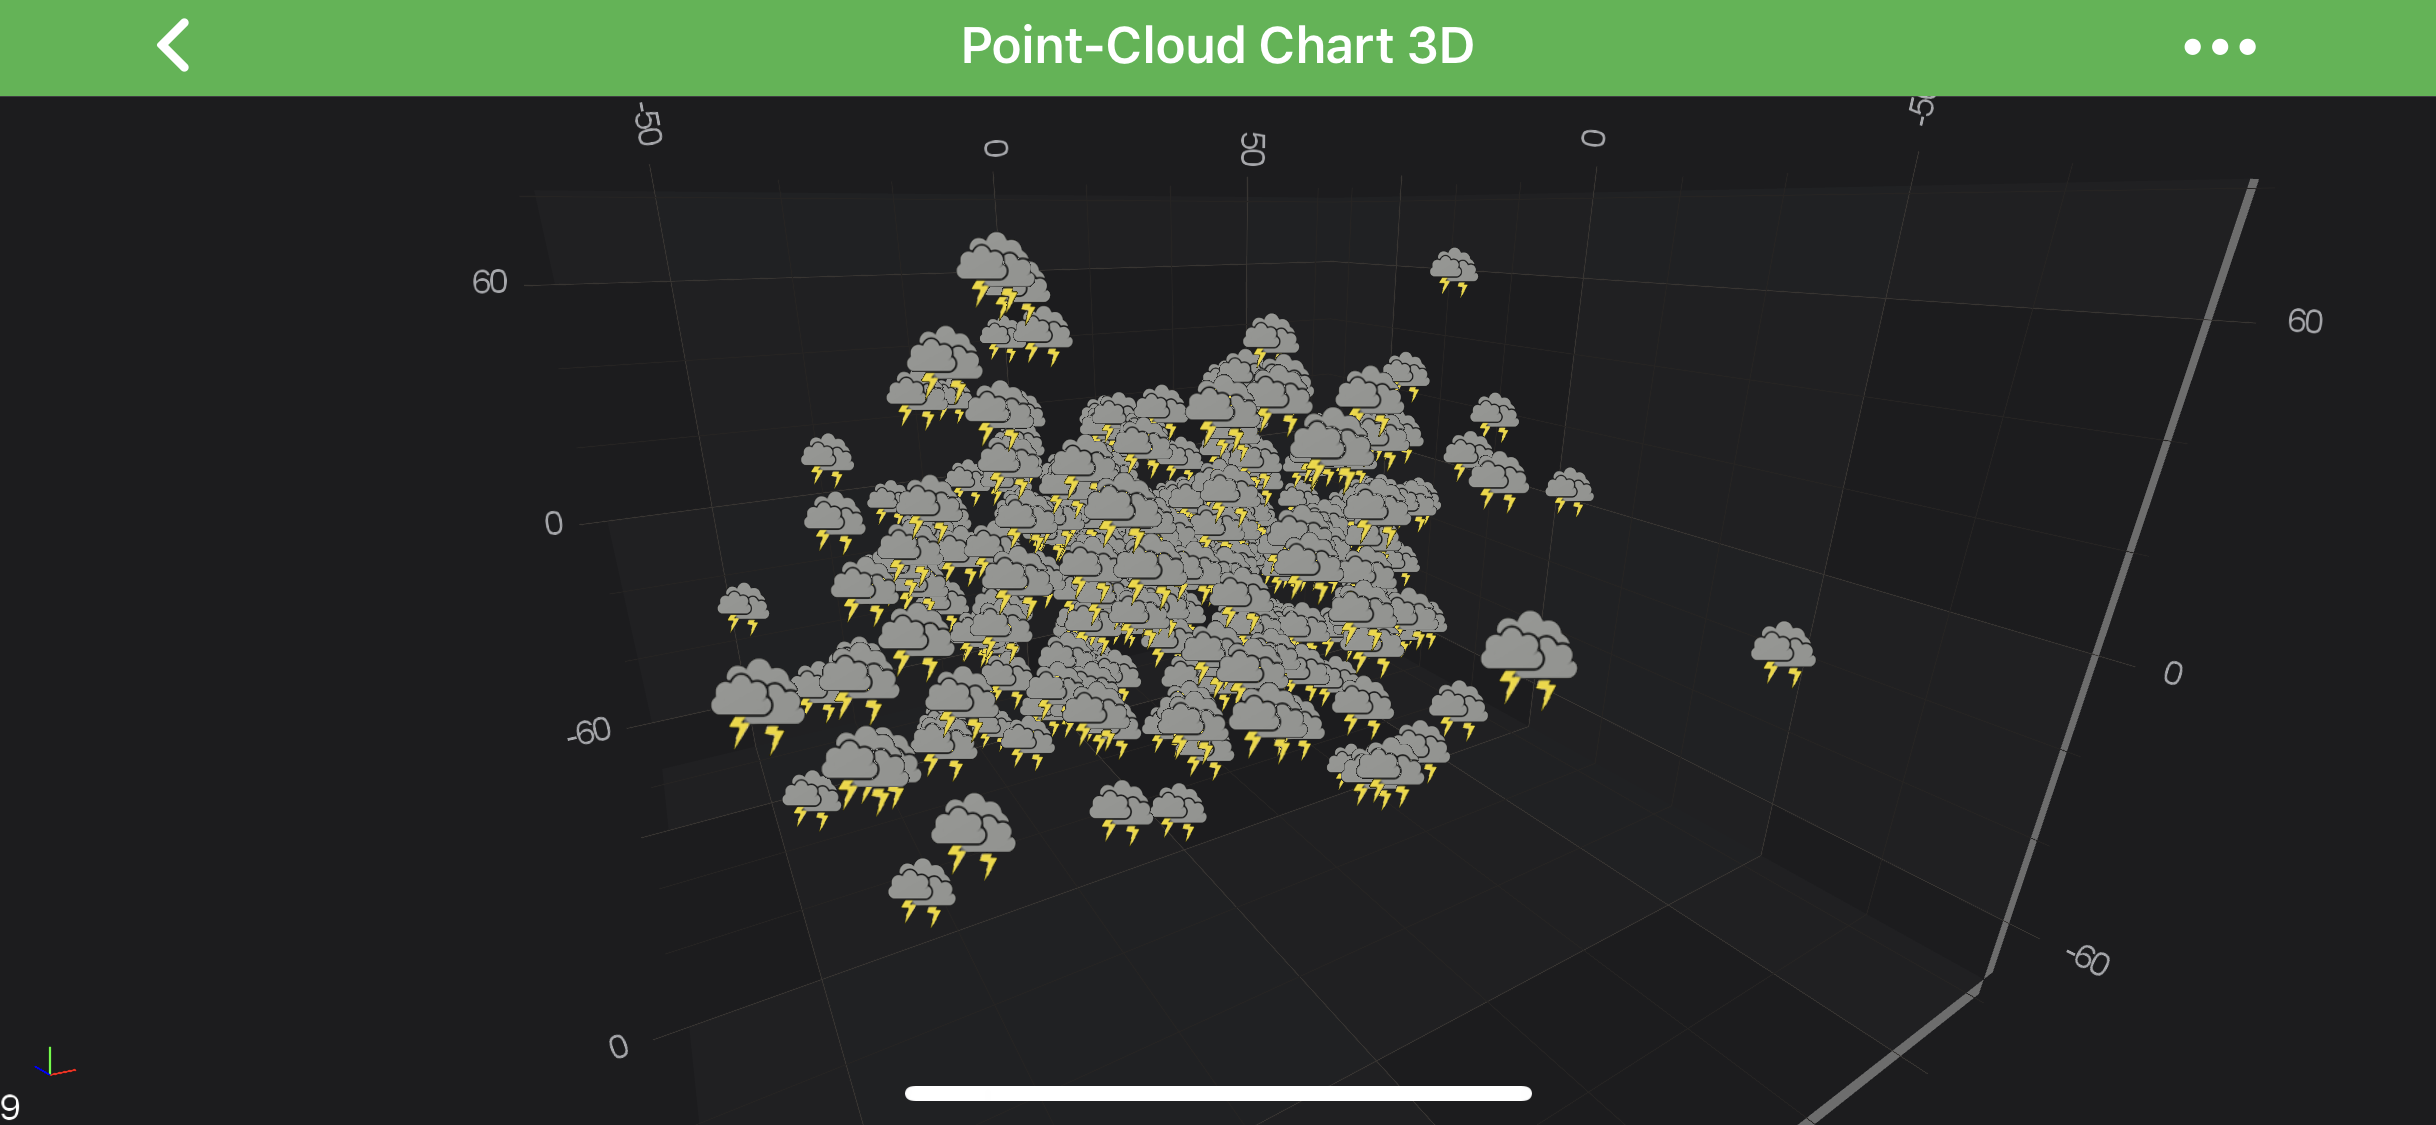
// Create custom PointMarker 3D
final Bitmap bitmap = BitmapFactory.decodeResource(getContext().getResources(), R.drawable.example_weather_storm);
CustomPointMarker3D pointMarker = new CustomPointMarker3D(bitmap);
pointMarker.setSize(10);

// Apply the PointMarker to a PointLine Series 3D
final ScatterRenderableSeries3D rs = new ScatterRenderableSeries3D();
rs.setPointMarker(pointMarker);
This would result in the following chart: