The Impulse Series 3D
The 3D Impulse (Stem) Charts are provided by the ImpulseRenderableSeries3D class.
A stem chart is visualized by small stems pointing up or down to a value with a sphere or marker at the top.
Note
Examples for the Impulse Series 3D can be found in the SciChart Android Examples Suite as well as on GitHub:
Create a Impulse Series 3D
In SciChart you can have either Uniform or Non-Uniform Impulse Series 3D. Both are provided by the ImpulseRenderableSeries3D but underlying IDataSeries3D<TX,TY,TZ> is different.
ImpulseRenderableSeries3D allow you to specify the stroke color of the lines(stems) as well as it's thickness via the corresponding properties:
In addition, in the same manner as a Scatter Series 3D - Impulse Series 3D requires a shape to be specified using one of the BasePointMarker3D and assigning it to the pointMarker property. There are number of PointMarkers available out of the box:
| Flat-Texture PointMarkers | Mesh (Volumetric) PointMarkers |
|---|---|
| TrianglePointerMarker3D | PyramidPointMarker3D |
| QuadPointMarker3D | CubePointMarker3D |
| EllipsePointMarker3D | SpherePointMarker3D |
| PixelPointMarker3D | CylinderPointMarker3D |
| CustomPointMarker3D |
It is also possible to define custom texture for the Point Markers via the CustomPointMarker3D. Please refer to the PointMarkers 3D API article to learn more.
Note
Same way as with other 3D Chart Types you can use The MetadataProvider API.
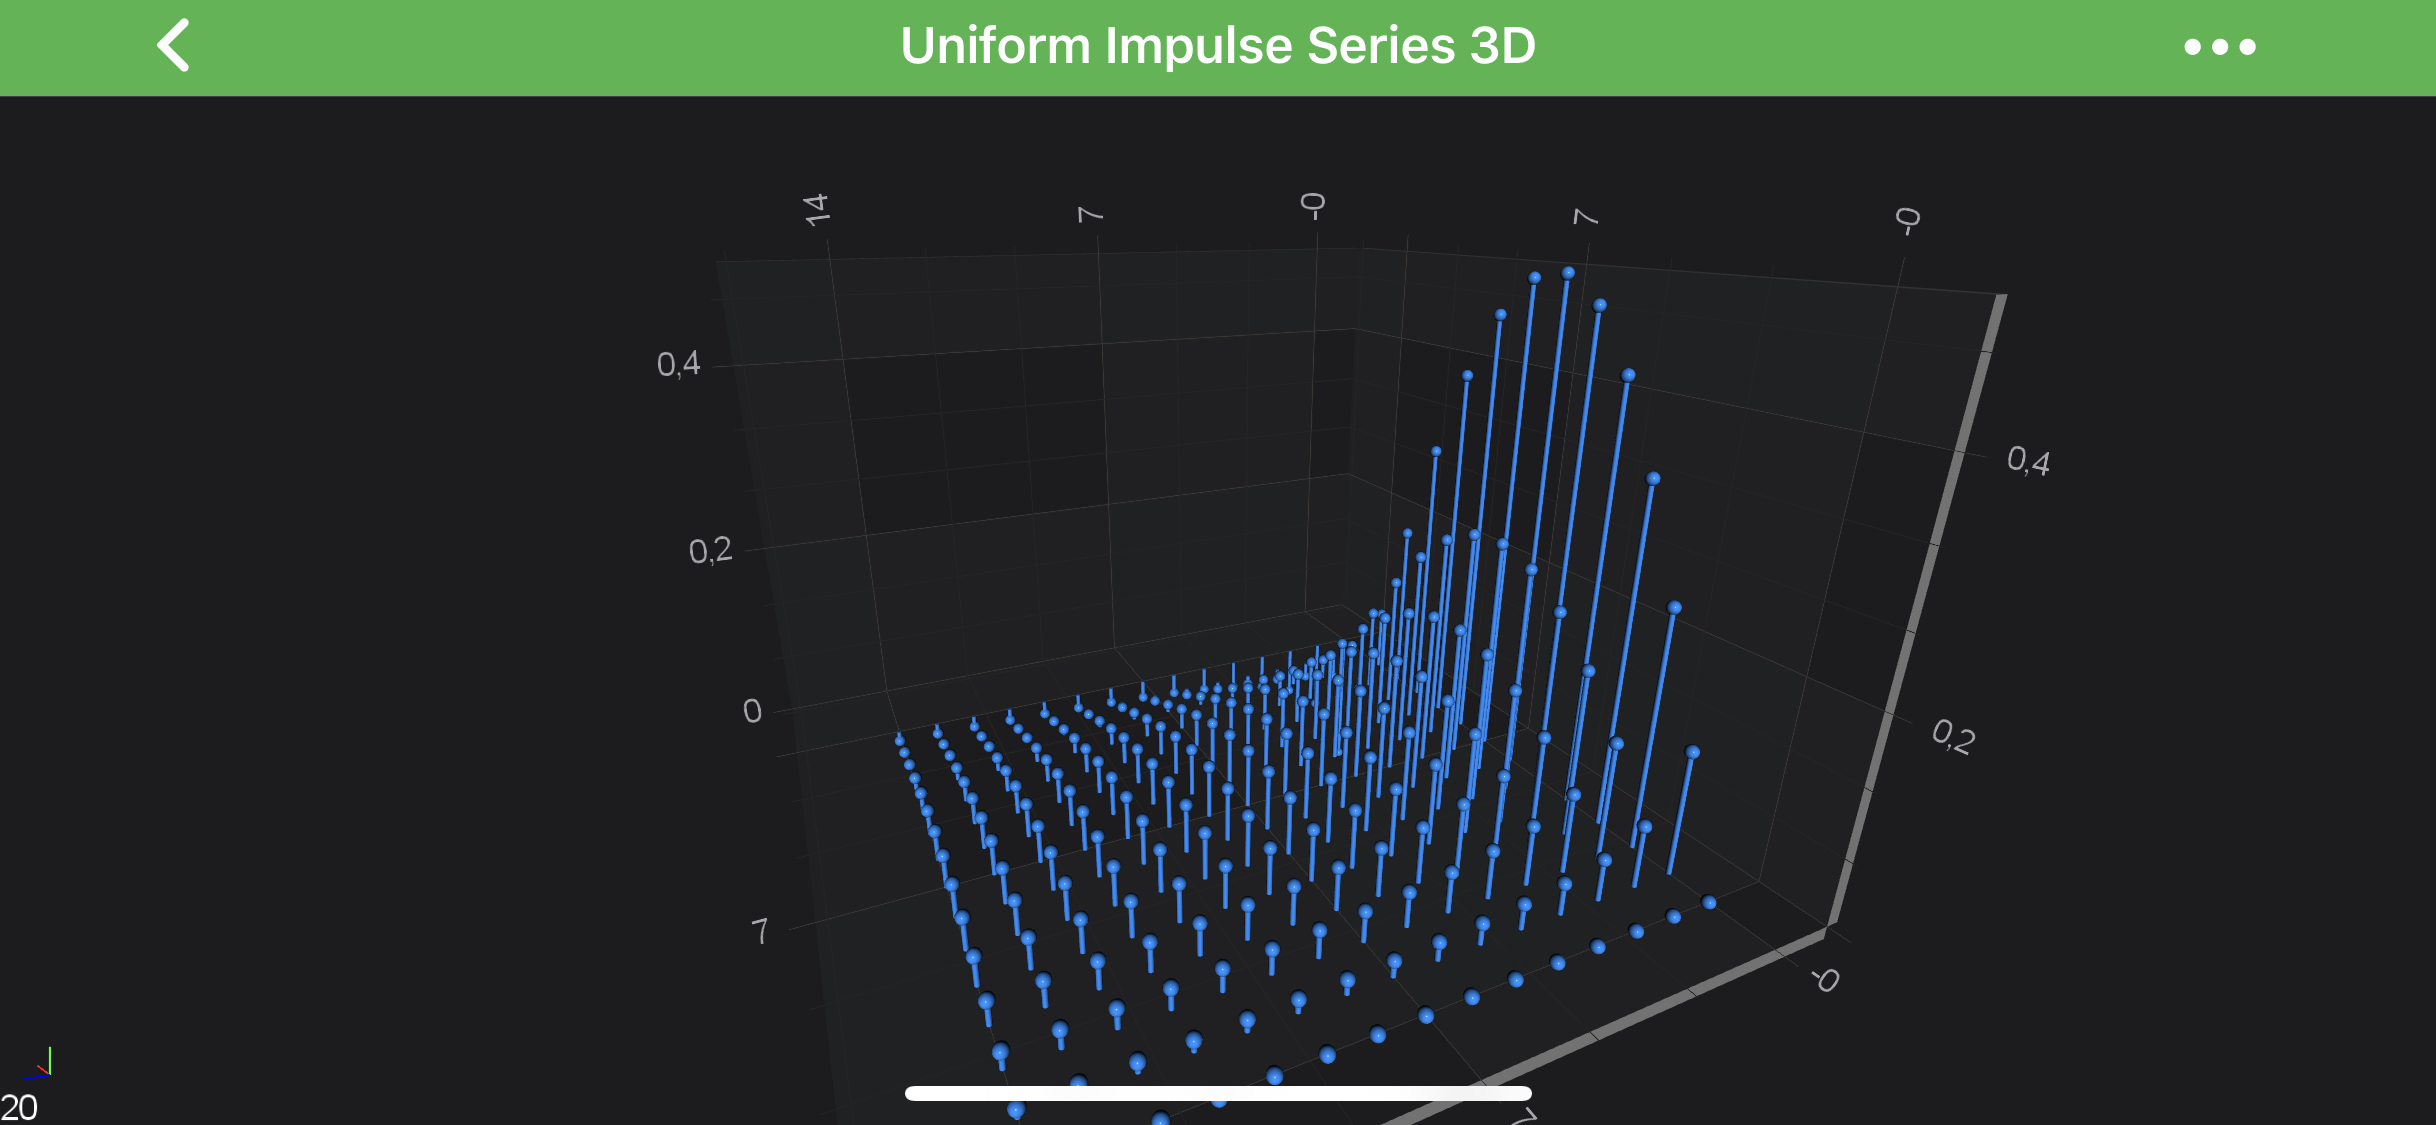
Uniform Impulse Series 3D
In order to create Uniform Impulse Series 3D - you will need to provide the UniformGridDataSeries3D<TX,TY,TZ> with N x M array of points.
The above graph is rendered with the following code:
final NumericAxis3D xAxis = new NumericAxis3D();
xAxis.setGrowBy(new DoubleRange(.1, .1));

final NumericAxis3D yAxis = new NumericAxis3D();
yAxis.setVisibleRange(new DoubleRange(0.0, .5));
yAxis.setGrowBy(new DoubleRange(.1, .1));

final NumericAxis3D zAxis = new NumericAxis3D();
zAxis.setGrowBy(new DoubleRange(.1, .1));

final UniformGridDataSeries3D<Double, Double, Double> ds = new UniformGridDataSeries3D<>(Double.class, Double.class, Double.class, COUNT, COUNT);

for (int x = 0; x < COUNT; x++) {
    for (int z = 0; z < COUNT; z++) {
        final double y = Math.sin(x * .25) / ((z + 1) * 2);

        ds.updateYAt(x, z, y);
    }
}

final SpherePointMarker3D pointMarker = new SpherePointMarker3D();
pointMarker.setSize(5);
pointMarker.setFill(0xFF1E90FF);

final ImpulseRenderableSeries3D rs = new ImpulseRenderableSeries3D();
rs.setDataSeries(ds);
rs.setStroke(0xFF1E90FF);
rs.setStrokeThickness(convertValueToDp(2f));
rs.setPointMarker(pointMarker);

UpdateSuspender.using(surface, () -> {
    surface.setXAxis(xAxis);
    surface.setYAxis(yAxis);
    surface.setZAxis(zAxis);
    surface.getRenderableSeries().add(rs);
    surface.getChartModifiers().add(createDefaultModifiers3D());
});
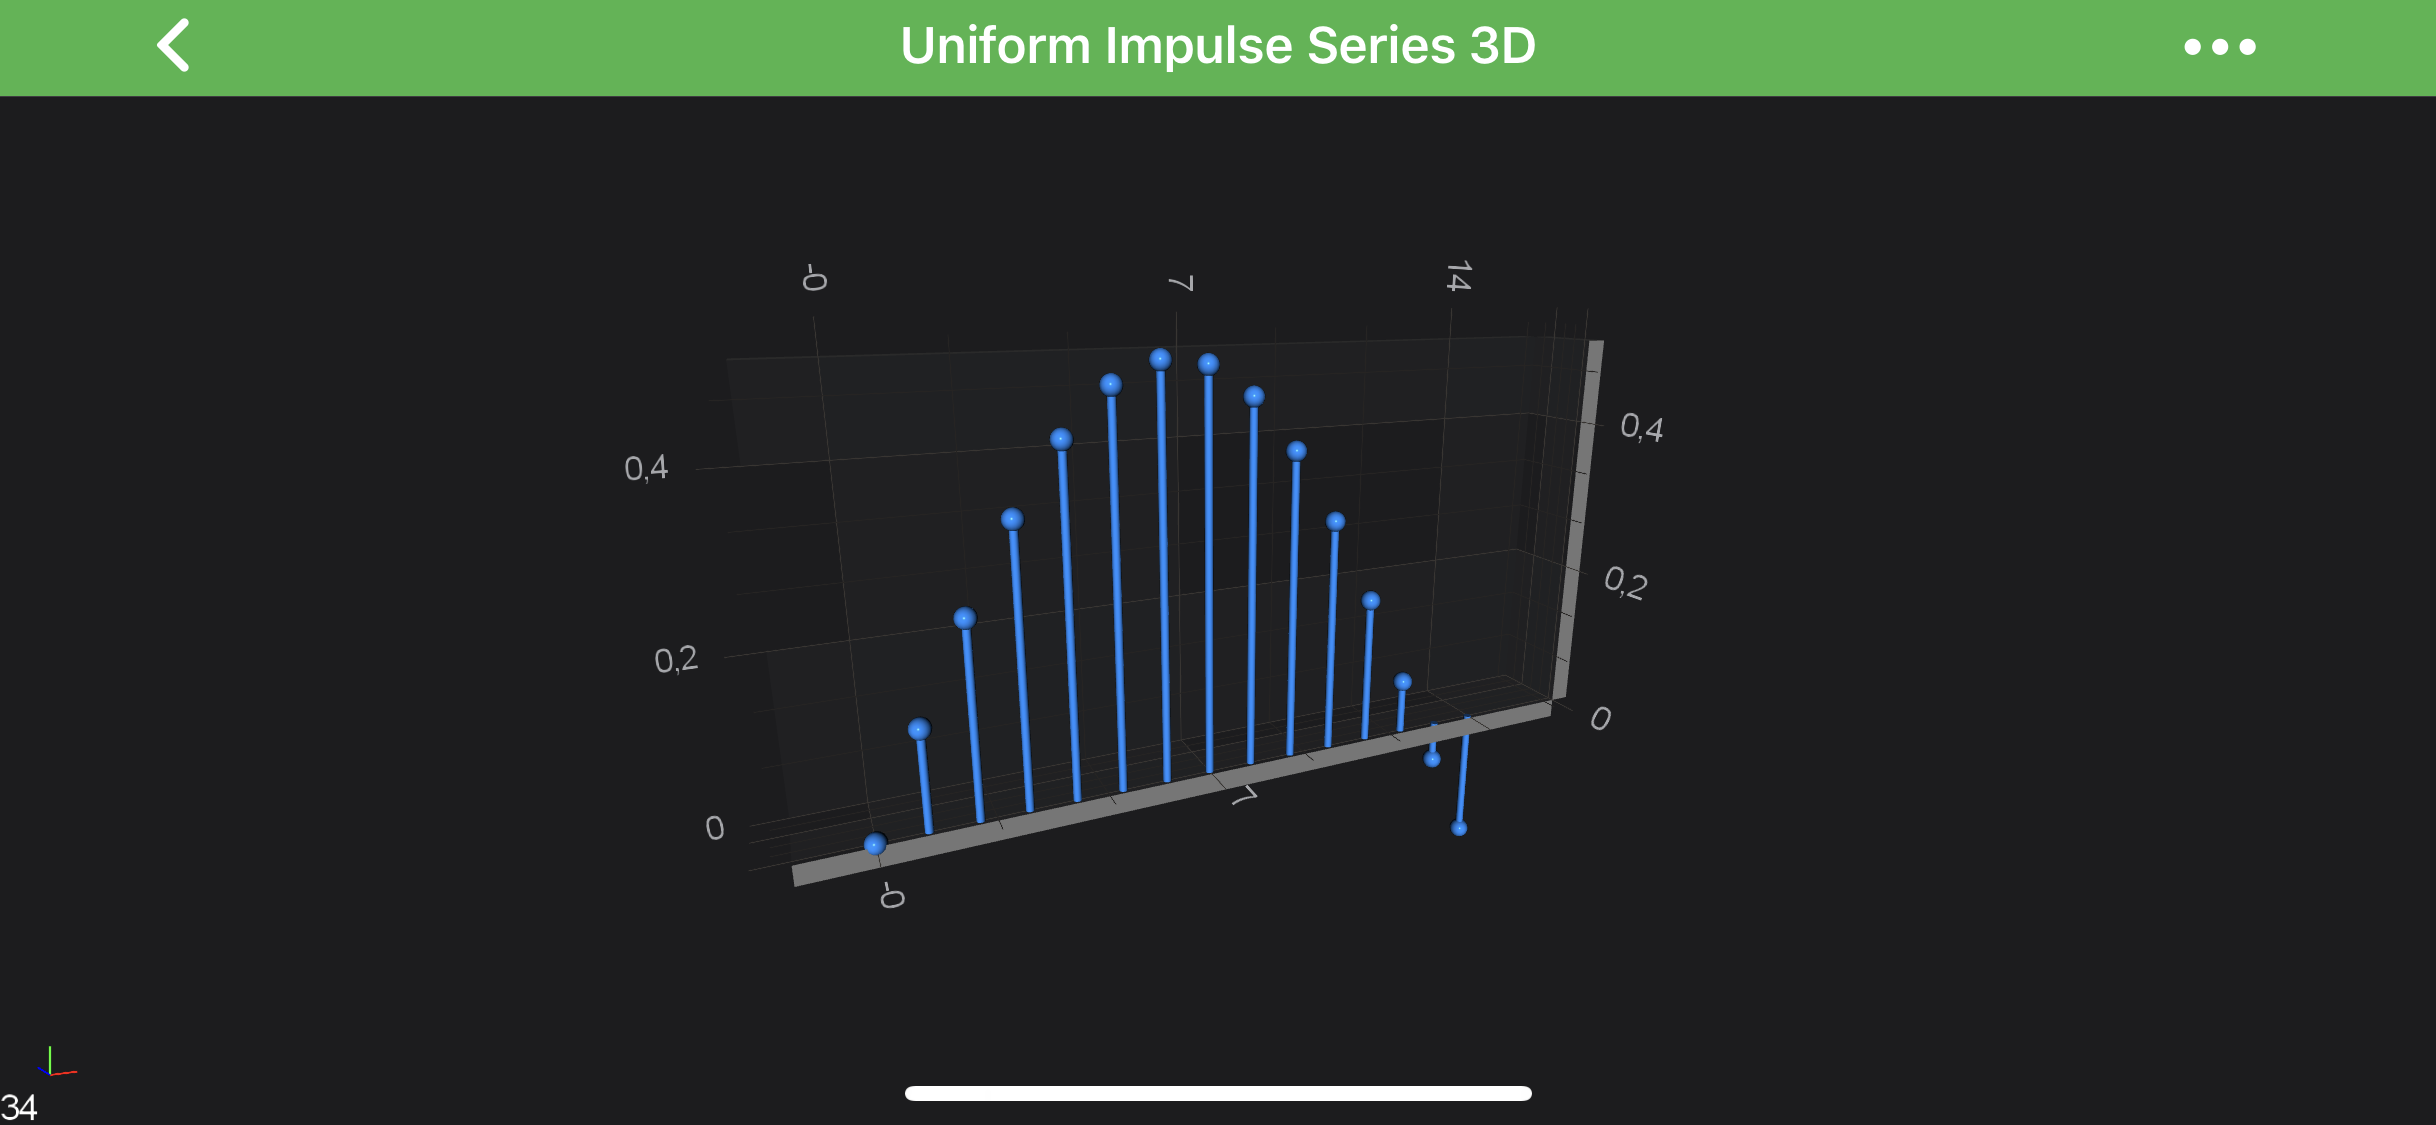
Single Row Impulse 3D Charts
You might also want to create a Single-Row of 3D Impulses.
It's easily achievable via providing UniformGridDataSeries3D<TX,TY,TZ> with size of 1 in Z-Direction and update the worldDimensions like below:
final UniformGridDataSeries3D<Double, Double, Double> ds = new UniformGridDataSeries3D<>(Double.class, Double.class, Double.class, COUNT, COUNT);

for (int x = 0; x < COUNT; x++) {
    for (int z = 0; z < COUNT; z++) {
        final double y = Math.sin(x * .25) / ((z + 1) * 2);

        ds.updateYAt(x, z, y);
    }
}
surface.getWorldDimensions().assign(200, 100, 20);
and results in the following chart:
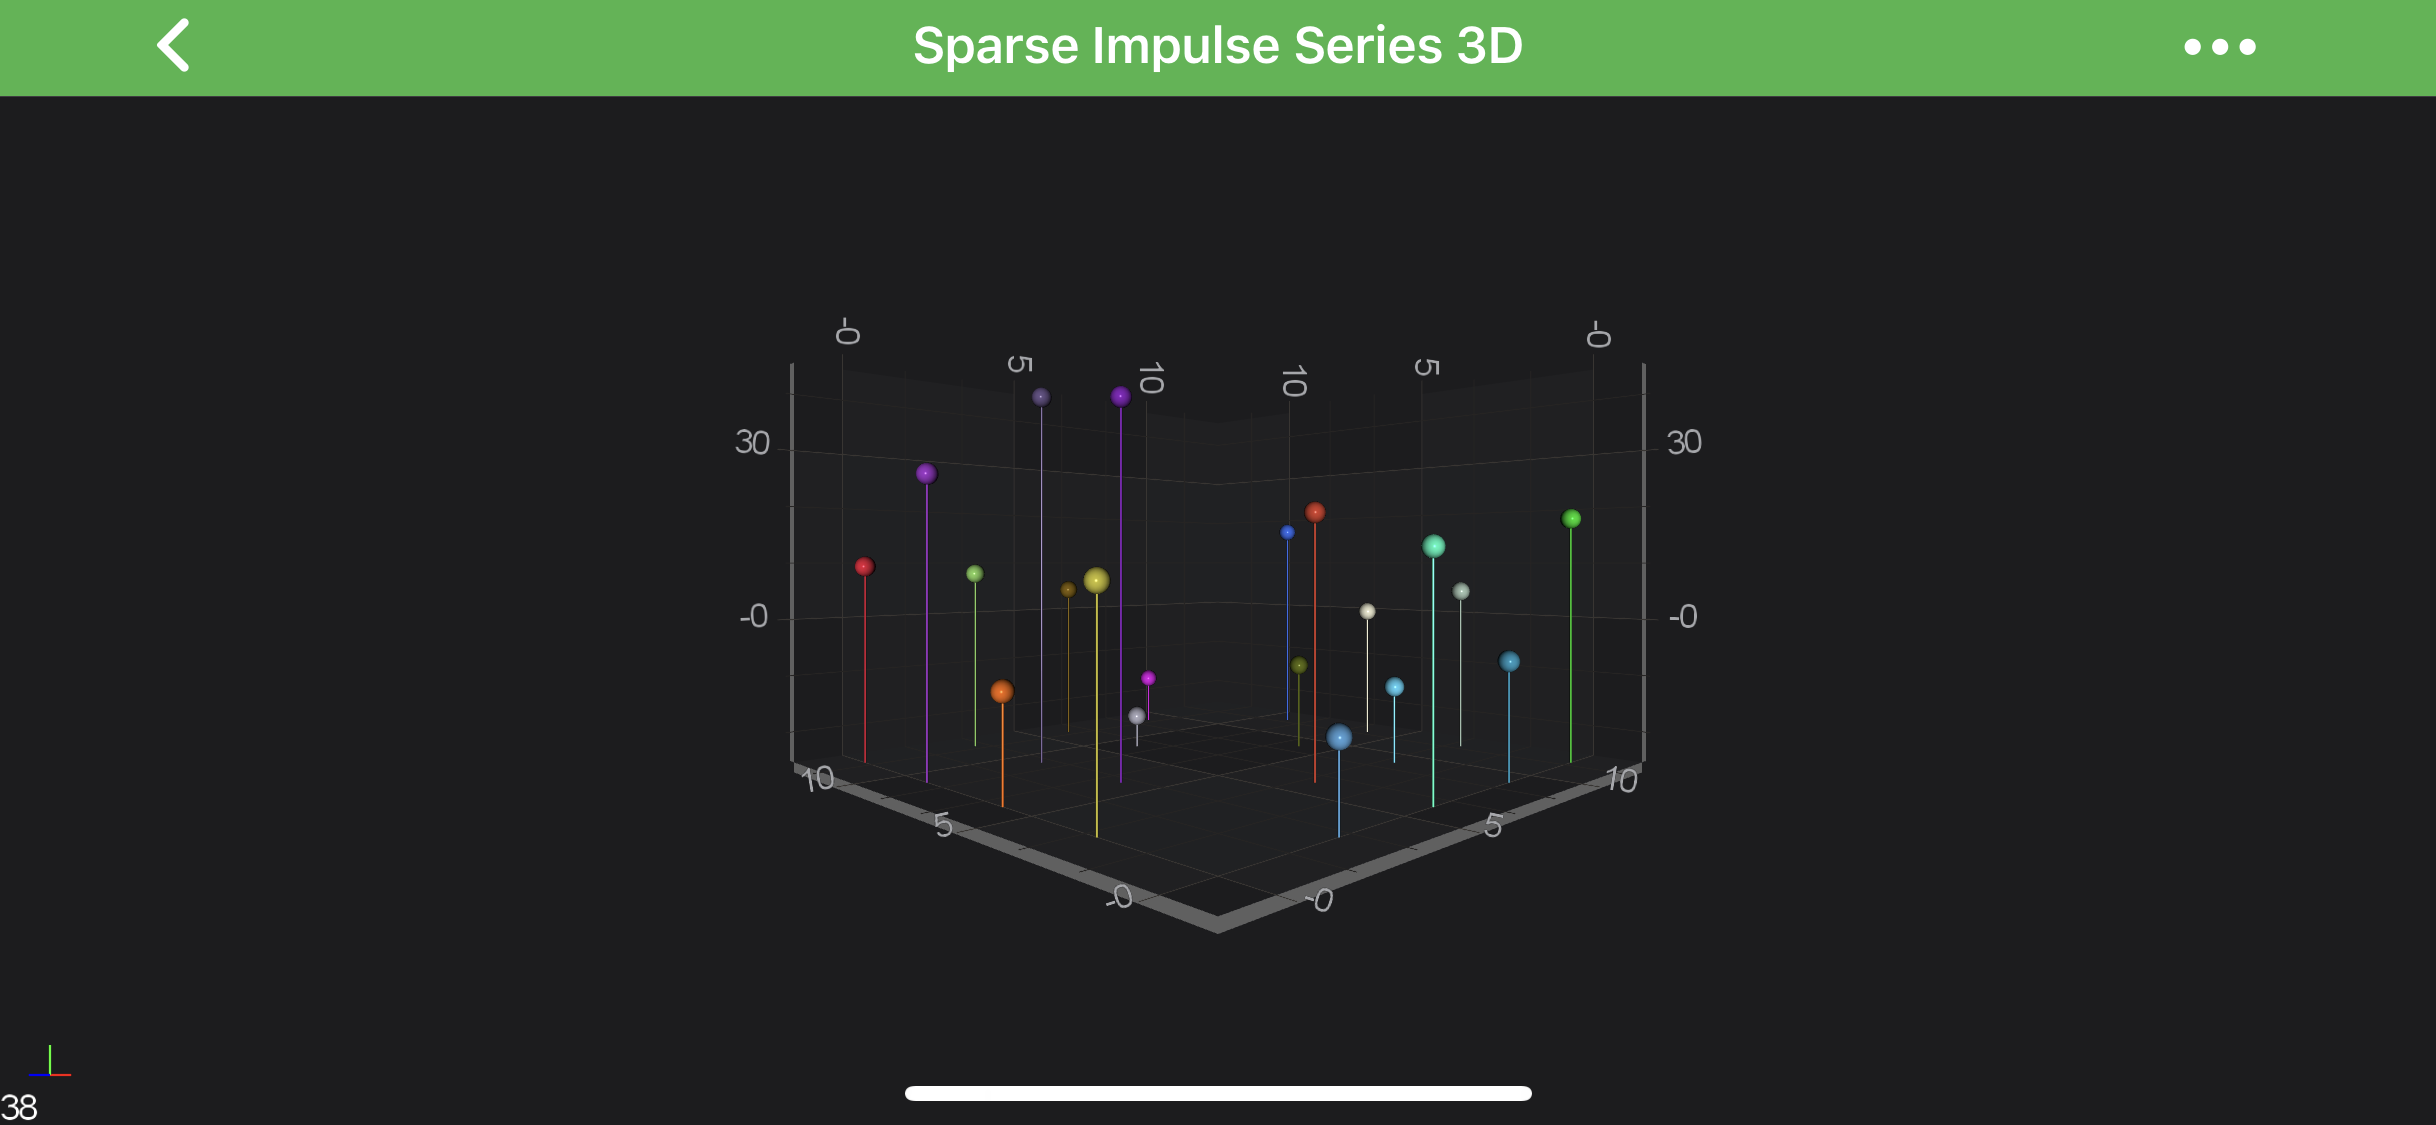
Non-Uniform Impulse Series 3D
In order to create Non-Uniform Impulse Series 3D - you will need to provide the XyzDataSeries3D with points.
final XyzDataSeries3D<Double, Double, Double> ds = new XyzDataSeries3D<>(Double.class, Double.class, Double.class);
final PointMetadataProvider3D metadataProvider = new PointMetadataProvider3D();

for (double i = 1; i < COUNT; i++) {
    for (double j = 1; j <= COUNT; j++) {
        if (i != j && i % 2 == 0 && j % 2 == 0) {
            final double y = dataManager.getGaussianRandomNumber(15, 1.5);
            ds.append(i, y, j);

            final PointMetadataProvider3D.PointMetadata3D metadata = new PointMetadataProvider3D.PointMetadata3D(dataManager.getRandomColor());
            metadataProvider.metadata.add(metadata);
        }
    }
}

final ImpulseRenderableSeries3D rs = new ImpulseRenderableSeries3D();
rs.setDataSeries(ds);
rs.setMetadataProvider(metadataProvider);
which will result in the following chart:
Note
Full example code for the Impulse Column Series 3D can be found in the SciChart Android Examples Suite as well as on GitHub: