Search Results for

    Show / Hide Table of Contents

    MetadataProvider 3D API

    SciChart Android 3D features a rich MetadataProvider API with gives the ability to change color on a point-by-point basis.

    MetadataProvider API

    Note

    Examples of using MetadataProvider API can be found in the SciChart Android Examples Suite as well as on GitHub:

    • Native Example
    • Xamarin Example

    To enable series coloring with MetadataProvider, you need to create a class which conforms to one of the following protocol (or possibly to all of them):

    Protocol Descriptions
    IPointMetadataProvider3D allows changing the fill for PointMarkers 3D.
    IStrokeMetadataProvider3D allows painting parts of the series' stroke;
    IFillMetadataProvider3D allows changing the fill color for IRenderableSeries3D.
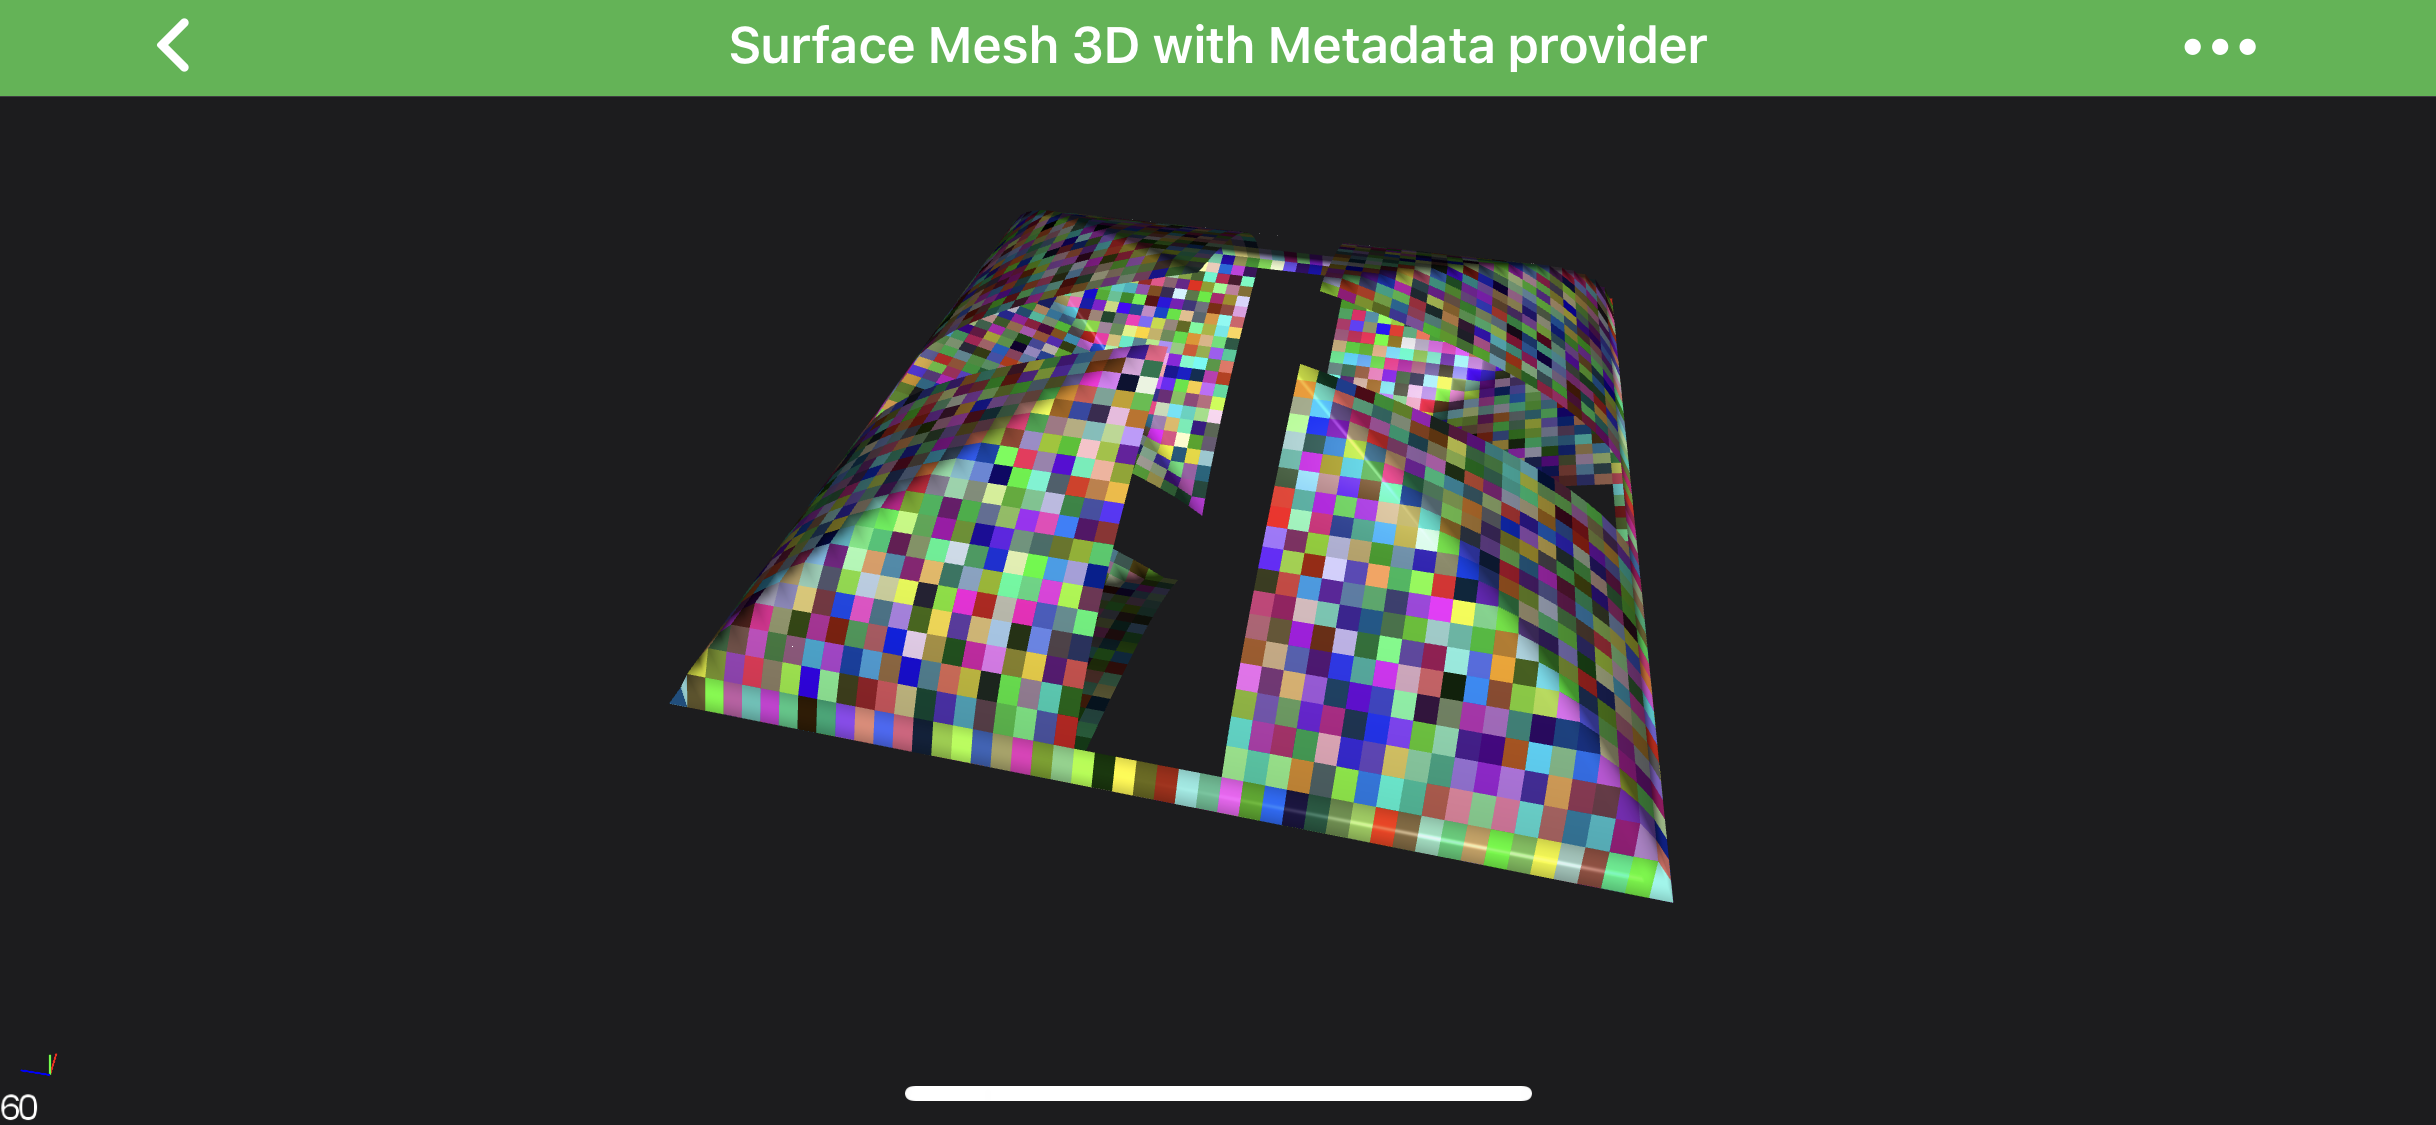
    ISurfaceMeshMetadataProvider3D allows overriding a specific cell or cells in the for SurfaceMeshRenderableSeries3D.
    ISelectableMetadataProvider3D allows provide different colors for selected points.
    Note

    The MetadataProvider API is very similar to the PaletteProvider API from SciChart 2D.

    A choice depends on a RenderableSeries 3D type, which MetadataProvider 3D is designed for.

    Each MetadataProvider protocol declares method(s), which provides a way to update series colors for every data points. Mentioned methods are called every time RenderableSeries 3D requires a redraw, so it expects that the colors array should be updated there correspondingly.

    For the convenience, there is the MetadataProvider3DBase<T> class, which provides some basic implementation, so it's recommended to inherit from it while implementing custom MetadataProvider. There is also some predefined MetadataProviders listed below:

    • DefaultSelectableMetadataProvider3D - allows provide different colors for selected points. You can find it in our examples which demonstrate selection such as - Waterfall Chart 3D and Select Scatter Point 3D Chart.

    Create Custom MetadataProvider

    The following code snippet demonstrates how to create a custom MetadataProvider which conforms to the - Stroke and PointMarker - metadata providers and colors them respectively to the orbitalYaw and orbitalPitch.

    Note

    The below code is based on the Point-Line Chart 3D example which can be found in the SciChart Android Examples Suite as well as on GitHub:

    • Native Example
    • Xamarin Example
    • Java
    • Java with Builders API
    • Kotlin
    class CustomMetadataProvider extends MetadataProvider3DBase<PointLineRenderableSeries3D> implements IPointMetadataProvider3D, IStrokeMetadataProvider3D {
        CustomMetadataProvider() {
            super(PointLineRenderableSeries3D.class);
        }
    
        @Override
        public void updateStrokeColors(IntegerValues integerValues, int i) {
            updateColors(integerValues);
        }
    
        @Override
        public void updatePointMetadata(IntegerValues integerValues, FloatValues floatValues, int i, float v) {
            updateColors(integerValues);
    
            final int pointsCount = renderableSeries.getCurrentRenderPassData().getPointsCount();
            floatValues.setSize(pointsCount);
    
            for (int x = 0; x < pointsCount; x++) {
                floatValues.set(i, 1);
            }
        }
    
        void updateColors(IntegerValues colors) {
            PointLineRenderableSeries3D rSeries = renderableSeries;
            XyzRenderPassData3D renderPassData = (XyzRenderPassData3D)rSeries.getCurrentRenderPassData();
    
            double upperThreshold = rSeries.getParentSurface().getCamera().getOrbitalYaw() % 90;
            double lowerThreshold = rSeries.getParentSurface().getCamera().getOrbitalPitch() % 90;
    
            int pointsCount = renderPassData.getPointsCount();
            colors.setSize(pointsCount);
    
            final DoubleValues yValues = renderPassData.yValues;
    
            for (int i = 0; i < pointsCount; i++) {
                double value = yValues.get(i);
                if (value > upperThreshold) {
                    colors.set(i, 0xffff0000);
                } else if (value < lowerThreshold) {
                    colors.set(i, 0xff00ff00);
                } else {
                    colors.set(i, 0xffffff00);
                }
            }
        }
    }
    
    class CustomMetadataProvider :
        MetadataProvider3DBase<PointLineRenderableSeries3D>(PointLineRenderableSeries3D::class.java),
        IPointMetadataProvider3D, IStrokeMetadataProvider3D {
        override fun updateStrokeColors(integerValues: IntegerValues, i: Int) {
            updateColors(integerValues)
        }
    
        override fun updatePointMetadata(integerValues: IntegerValues, floatValues: FloatValues, i: Int, v: Float) {
            updateColors(integerValues)
            val pointsCount = renderableSeries!!.currentRenderPassData.pointsCount
            floatValues.setSize(pointsCount)
            for (x in 0 until pointsCount) {
                floatValues[i] = 1f
            }
        }
    
        fun updateColors(colors: IntegerValues) {
            val rSeries = renderableSeries!!
            val renderPassData = rSeries.currentRenderPassData as XyzRenderPassData3D
    
            val upperThreshold = (rSeries.parentSurface.camera.orbitalYaw % 90).toDouble()
            val lowerThreshold = (rSeries.parentSurface.camera.orbitalPitch % 90).toDouble()
    
            val pointsCount = renderPassData.pointsCount
            colors.setSize(pointsCount)
    
            val yValues = renderPassData.yValues
    
            for (i in 0 until pointsCount) {
                val value = yValues[i]
                if (value > upperThreshold) {
                    colors[i] = -0x10000
                } else if (value < lowerThreshold) {
                    colors[i] = -0xff0100
                } else {
                    colors[i] = -0x100
                }
            }
        }
    }
    

    Once the MetadataProvider class is ready, its instances can be used to set it for a RenderableSeries via the metadataProvider property:

    • Java
    • Java with Builders API
    • Kotlin
    final NumericAxis3D xAxis = new NumericAxis3D();
    xAxis.setGrowBy(new DoubleRange(.1, .1));
    
    final NumericAxis3D yAxis = new NumericAxis3D();
    yAxis.setGrowBy(new DoubleRange(.1, .1));
    
    final NumericAxis3D zAxis = new NumericAxis3D();
    zAxis.setGrowBy(new DoubleRange(.1, .1));
    
    final XyzDataSeries3D<Double, Double, Double> ds = new XyzDataSeries3D<>(Double.class, Double.class, Double.class);
    for (int i = 0; i < 100; i++) {
        final double x = 5 * Math.sin(i);
        final double y = i;
        final double z = 5 * Math.cos(i);
        ds.append(x, y, z);
    }
    
    final SpherePointMarker3D pointMarker = new SpherePointMarker3D();
    pointMarker.setSize(5);
    
    final ImpulseRenderableSeries3D rs = new ImpulseRenderableSeries3D();
    rs.setDataSeries(ds);
    rs.setStrokeThickness(convertValueToDp(2f));
    rs.setPointMarker(pointMarker);
    rs.setMetadataProvider(new CustomMetadataProvider());
    
    UpdateSuspender.using(surface, () -> {
        surface.setXAxis(xAxis);
        surface.setYAxis(yAxis);
        surface.setZAxis(zAxis);
        surface.getRenderableSeries().add(rs);
        surface.getChartModifiers().add(createDefaultModifiers3D());
    });
    
    final NumericAxis3D xAxis = sciChart3DBuilder.newNumericAxis3D().withGrowBy(.1, .1).build();
    final NumericAxis3D yAxis = sciChart3DBuilder.newNumericAxis3D().withGrowBy(.1, .1).build();
    final NumericAxis3D zAxis = sciChart3DBuilder.newNumericAxis3D().withGrowBy(.1, .1).build();
    
    final XyzDataSeries3D<Double, Double, Double> ds = new XyzDataSeries3D<>(Double.class, Double.class, Double.class);
    for (int i = 0; i < 100; i++) {
        final double x = 5 * Math.sin(i);
        final double y = i;
        final double z = 5 * Math.cos(i);
        ds.append(x, y, z);
    }
    
    final SpherePointMarker3D pointMarker = sciChart3DBuilder.newSpherePointMarker3D()
            .withSize(5f)
            .build();
    
    final PointLineRenderableSeries3D rs = sciChart3DBuilder.newPointLinesSeries3D()
            .withDataSeries(ds)
            .withStrokeThicknes(2f)
            .withPointMarker(pointMarker)
            .withMetadataProvider(new CustomMetadataProvider())
            .build();
    
    UpdateSuspender.using(surface, () -> {
        surface.setXAxis(xAxis);
        surface.setYAxis(yAxis);
        surface.setZAxis(zAxis);
        surface.getRenderableSeries().add(rs);
        surface.getChartModifiers().add(createDefaultModifiers3D());
    });
    
    val xAxis = NumericAxis3D()
    xAxis.growBy = DoubleRange(.1, .1)
    
    val yAxis = NumericAxis3D()
    yAxis.growBy = DoubleRange(.1, .1)
    
    val zAxis = NumericAxis3D()
    zAxis.growBy = DoubleRange(.1, .1)
    
    val ds = XyzDataSeries3D(Double::class.java, Double::class.java, Double::class.java)
    for (i in 0..99) {
        val x = 5 * Math.sin(i.toDouble())
        val y = i.toDouble()
        val z = 5 * Math.cos(i.toDouble())
        ds.append(x, y, z)
    }
    
    val pointMarker = SpherePointMarker3D()
    pointMarker.size = 5f
    
    val rs = ImpulseRenderableSeries3D()
    rs.dataSeries = ds
    rs.strokeThickness = convertValueToDp(2f)
    rs.pointMarker = pointMarker
    rs.metadataProvider = CustomMetadataProvider()
    
    UpdateSuspender.using(surface) {
        surface.xAxis = xAxis
        surface.yAxis = yAxis
        surface.zAxis = zAxis
        surface.renderableSeries.add(rs)
        surface.chartModifiers.add(createDefaultModifiers3D())
    }
    

    Which will result with the following:

    Back to top © 2011-2025 SciChart. All rights reserved. | sitemap.xml