The Point-Line 3D Chart Type
The 3D Point-Line Charts are provided by the PointLineRenderableSeries3D class.
Note
Examples of the Point-Line 3D Series can be found in the SciChart Android Examples Suite as well as on GitHub:
Besides the Common Features which are shared between all 3D Chart Types, the PointLineRenderableSeries3D allows you to customize it's specific properties:
| Feature | Description |
|---|---|
| stroke | allows to specify the stroke color of the lines. |
| strokeThickness | allows to specify Line thickness. |
| isAntialiased | allows to specify if lines should be antialiased or not. |
| isLineStrips | Defines a value indicating whether the lines should be drawn as line strips or as separate lines. See the IsLineStrips Property section. |
Also, it is possible to show a gap in a Point-Line 3D Series simply by passing a data-point with a NaN as the Y value.
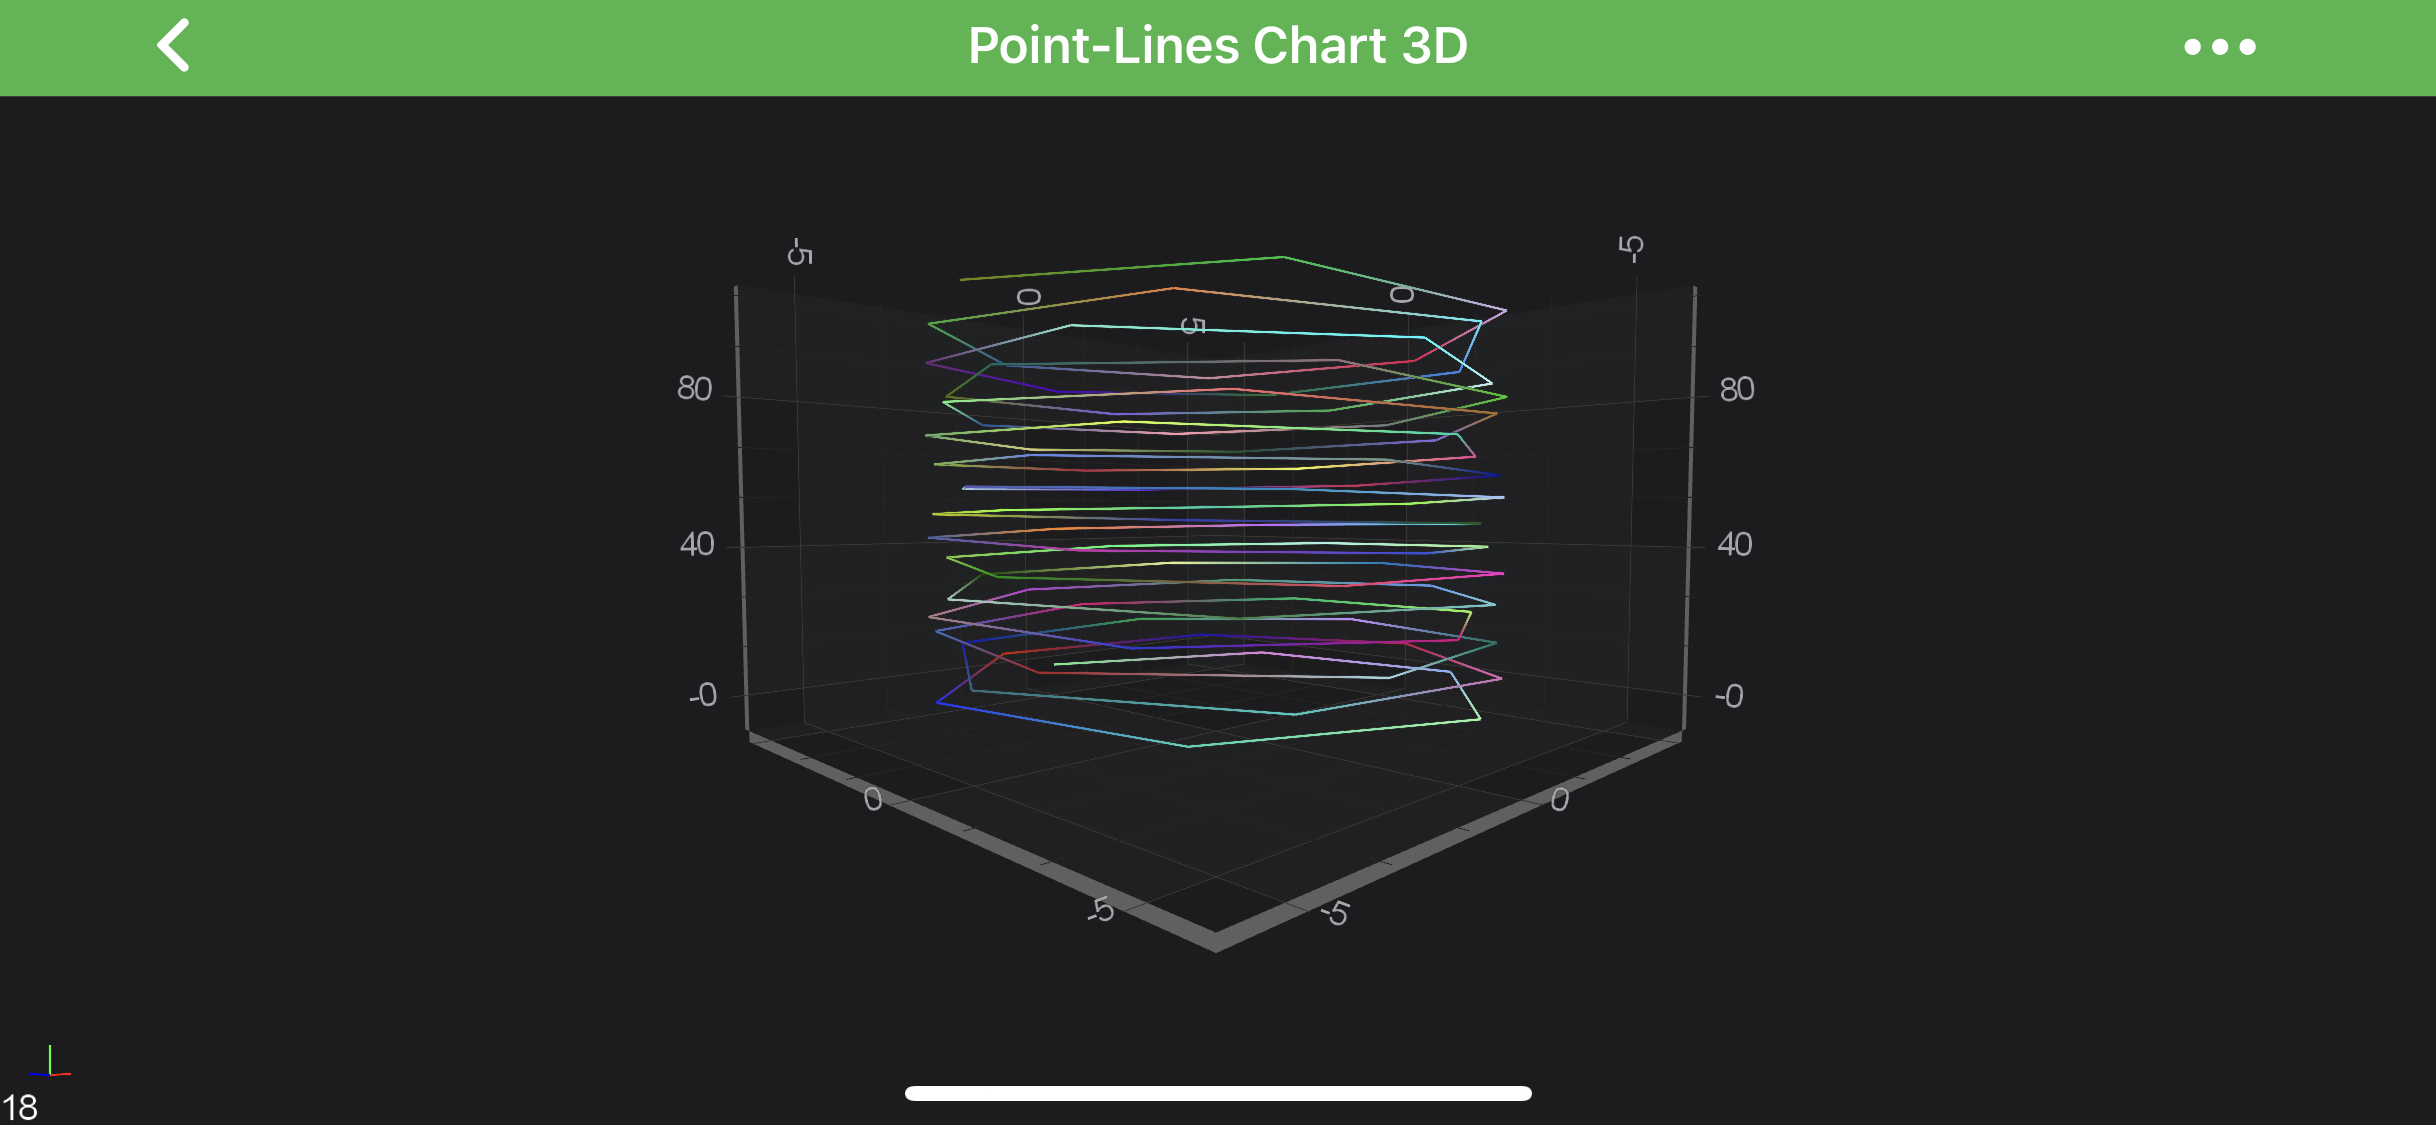
IsLineStrips Property
The PointLineRenderableSeries3D can be configured to split the line at every other point. This is quite useful if you want to use it to draw a free-form grid. That's achieved via the isLineStrips property.
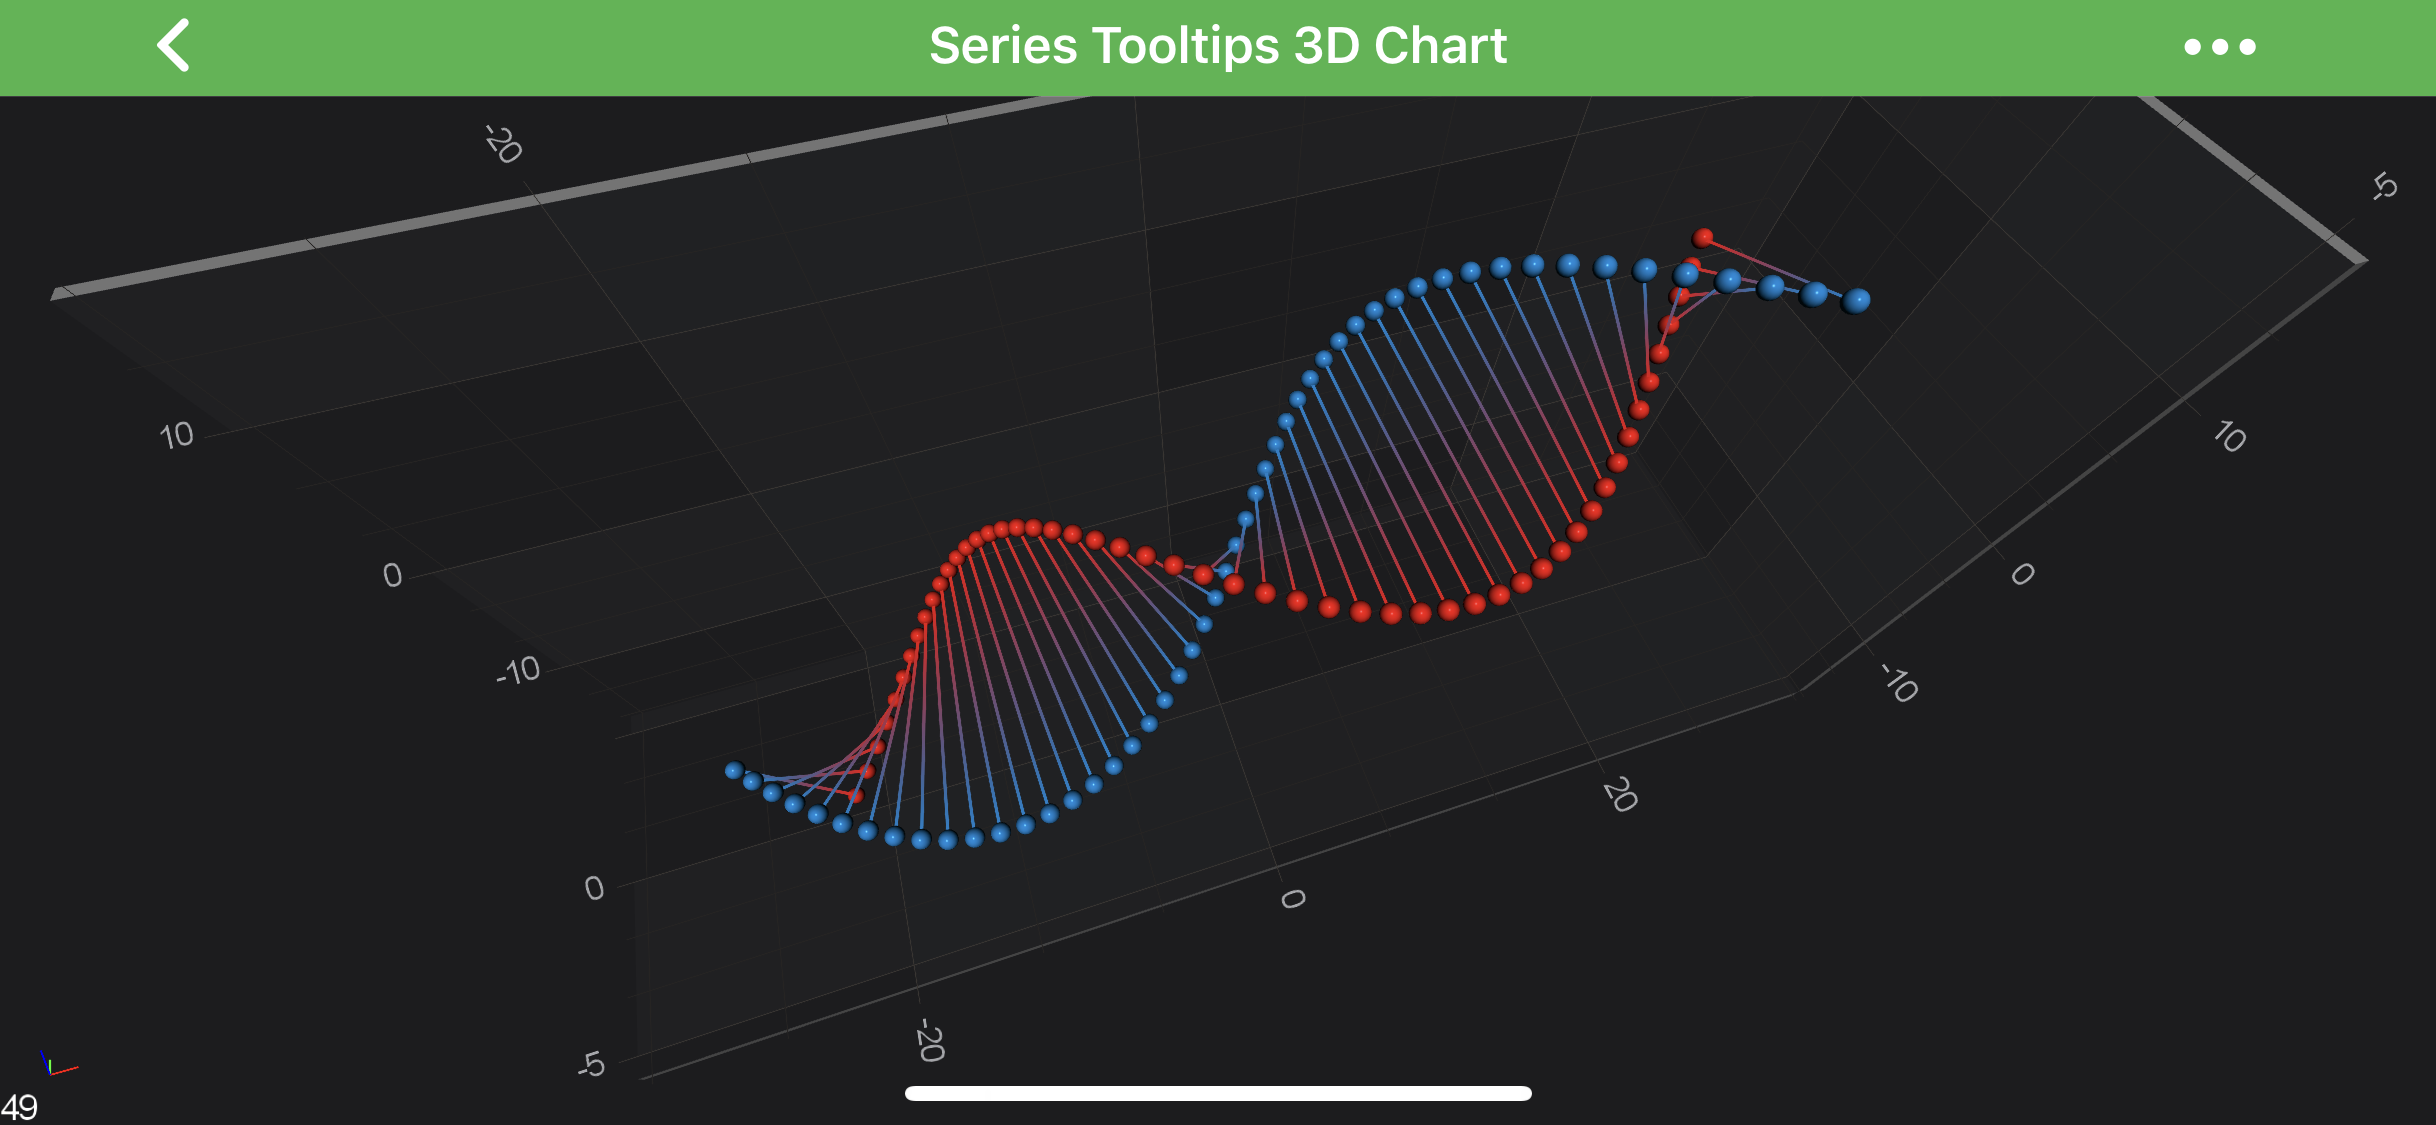
Note
Full example sources are available in 3D Charts -> Tooltips and Hit-Test 3D Charts -> Series Tooltips 3D Chart
Create a Line Series
To create a PointLineRenderableSeries3D, use the following code:
final NumericAxis3D xAxis = new NumericAxis3D();
xAxis.setGrowBy(new DoubleRange(.1, .1));

final NumericAxis3D yAxis = new NumericAxis3D();
yAxis.setGrowBy(new DoubleRange(.1, .1));

final NumericAxis3D zAxis = new NumericAxis3D();
zAxis.setGrowBy(new DoubleRange(.1, .1));

final XyzDataSeries3D<Double, Double, Double> ds = new XyzDataSeries3D<>(Double.class, Double.class, Double.class);
final PointMetadataProvider3D pointMetaDataProvider = new PointMetadataProvider3D();

for (int i = 0; i < 100; i++) {
    final double x = 5 * Math.sin(i);
    final double y = i;
    final double z = 5 * Math.cos(i);
    ds.append(x, y, z);

    final PointMetadataProvider3D.PointMetadata3D metadata = new PointMetadataProvider3D.PointMetadata3D(dataManager.getRandomColor());
    pointMetaDataProvider.metadata.add(metadata);
}

final SpherePointMarker3D pointMarker = new SpherePointMarker3D();
pointMarker.setFill(Color.RED);
pointMarker.setSize(10);

final PointLineRenderableSeries3D rs = new PointLineRenderableSeries3D();
rs.setDataSeries(ds);
rs.setStrokeThickness(convertValueToDp(3f));
rs.setPointMarker(pointMarker);
rs.setIsLineStrips(true);
rs.setMetadataProvider(pointMetaDataProvider);

UpdateSuspender.using(surface, () -> {
    surface.setXAxis(xAxis);
    surface.setYAxis(yAxis);
    surface.setZAxis(zAxis);
    surface.getRenderableSeries().add(rs);
    surface.getChartModifiers().add(createDefaultModifiers3D());
});
In the code above, a Point-Line Series 3D instance is created. It is assigned to draw the data that is provided by the IDataSeries3D<TX,TY,TZ> assigned to it.
The line is drawn with a stroke color provided by PointMetadataProvider3D instance, but in this particular example, we used our MetadataProvider 3D API, which provides custom colors for individual points of the series.
Finally, the Point-Line Series 3D is added to the getRenderableSeries() property.
Note
For more information about MetadataProviders - please refer to the MetadataProvider 3D API article.
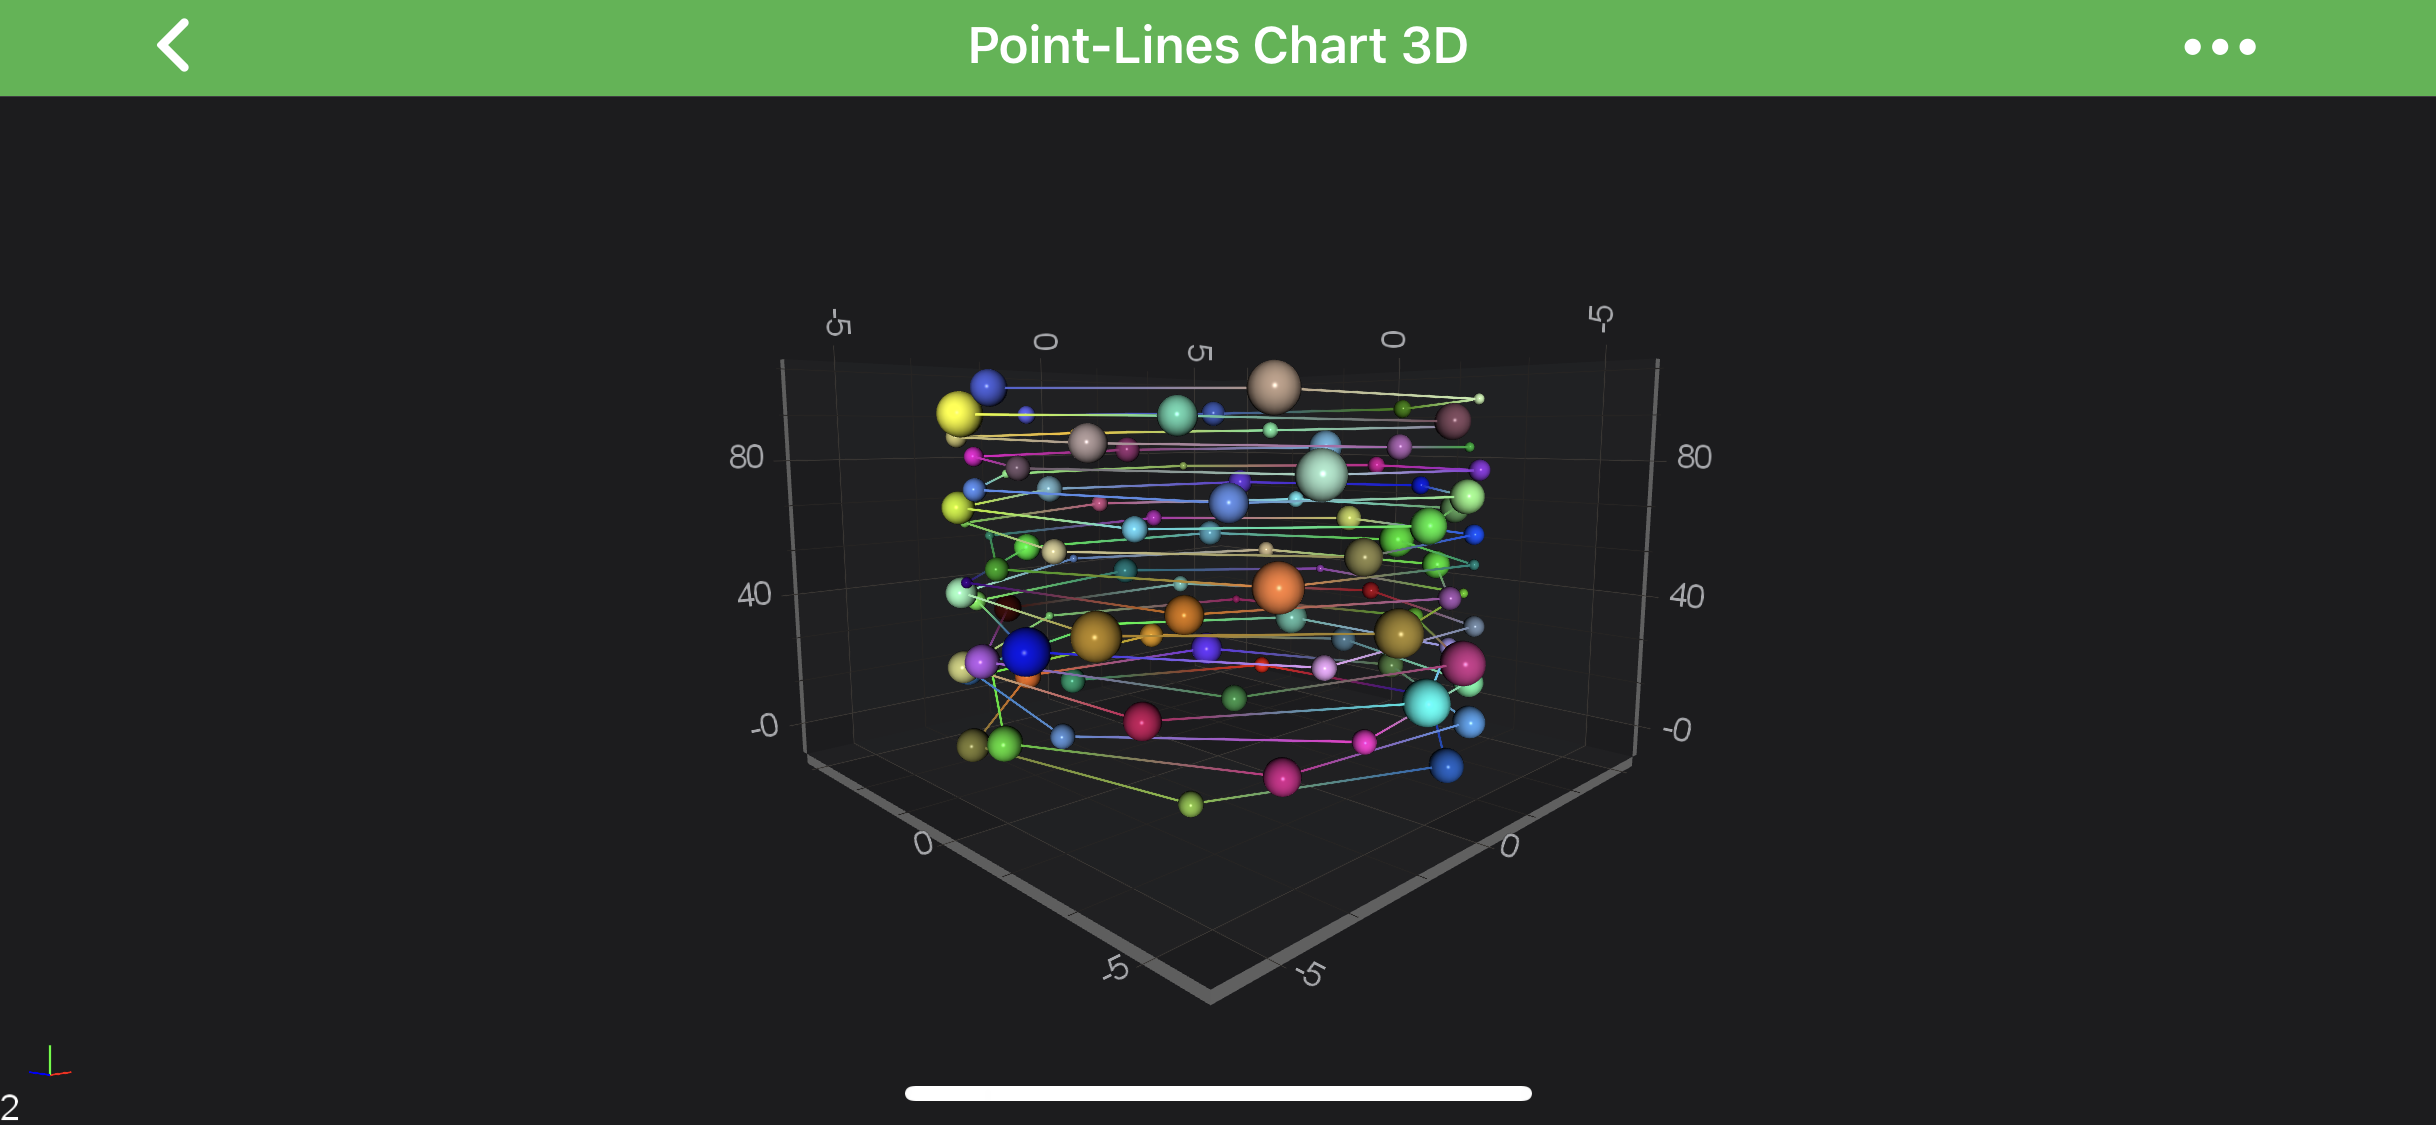
Add Point Markers onto a Point-Line3D Series
Every data point of a Point-Line 3D Series can be marked with a PointMarker 3D. To add Point Markers to the Point-Line 3D, use the following code:
final SpherePointMarker3D pointMarker = new SpherePointMarker3D();
pointMarker.setSize(5);

final PointLineRenderableSeries3D rs = new PointLineRenderableSeries3D();
rs.setPointMarker(pointMarker);
To learn more about Point Markers 3D, please refer to the PointMarkers 3D API article.
Note
This feature can be used to create a Scatter 3D Series.
Paint Line Segments With Different Colors
Is SciChart, you can draw line segments with different colors using the MetadataProvider 3D API. To Use metadata provider for Point-Line 3D Series - a PointMetadataProvider3D.PointMetadata3D has to be provided to the metadataProvider property. For more information - please refer to the MetadataProvider 3D API article.