SciChart® the market leader in Fast WPF Charts, WPF 3D Charts, iOS Chart, Android Chart and JavaScript Chart Components
SciChart Android ships with ~90Â Android Chart Examples which you can browse, play with, view the source-code and even export each SciChart Android Chart Example to a stand-alone Android Studio project. All of this is possible with the new and improved SciChart Android Examples Suite, which ships as part of our Android Charts SDK.
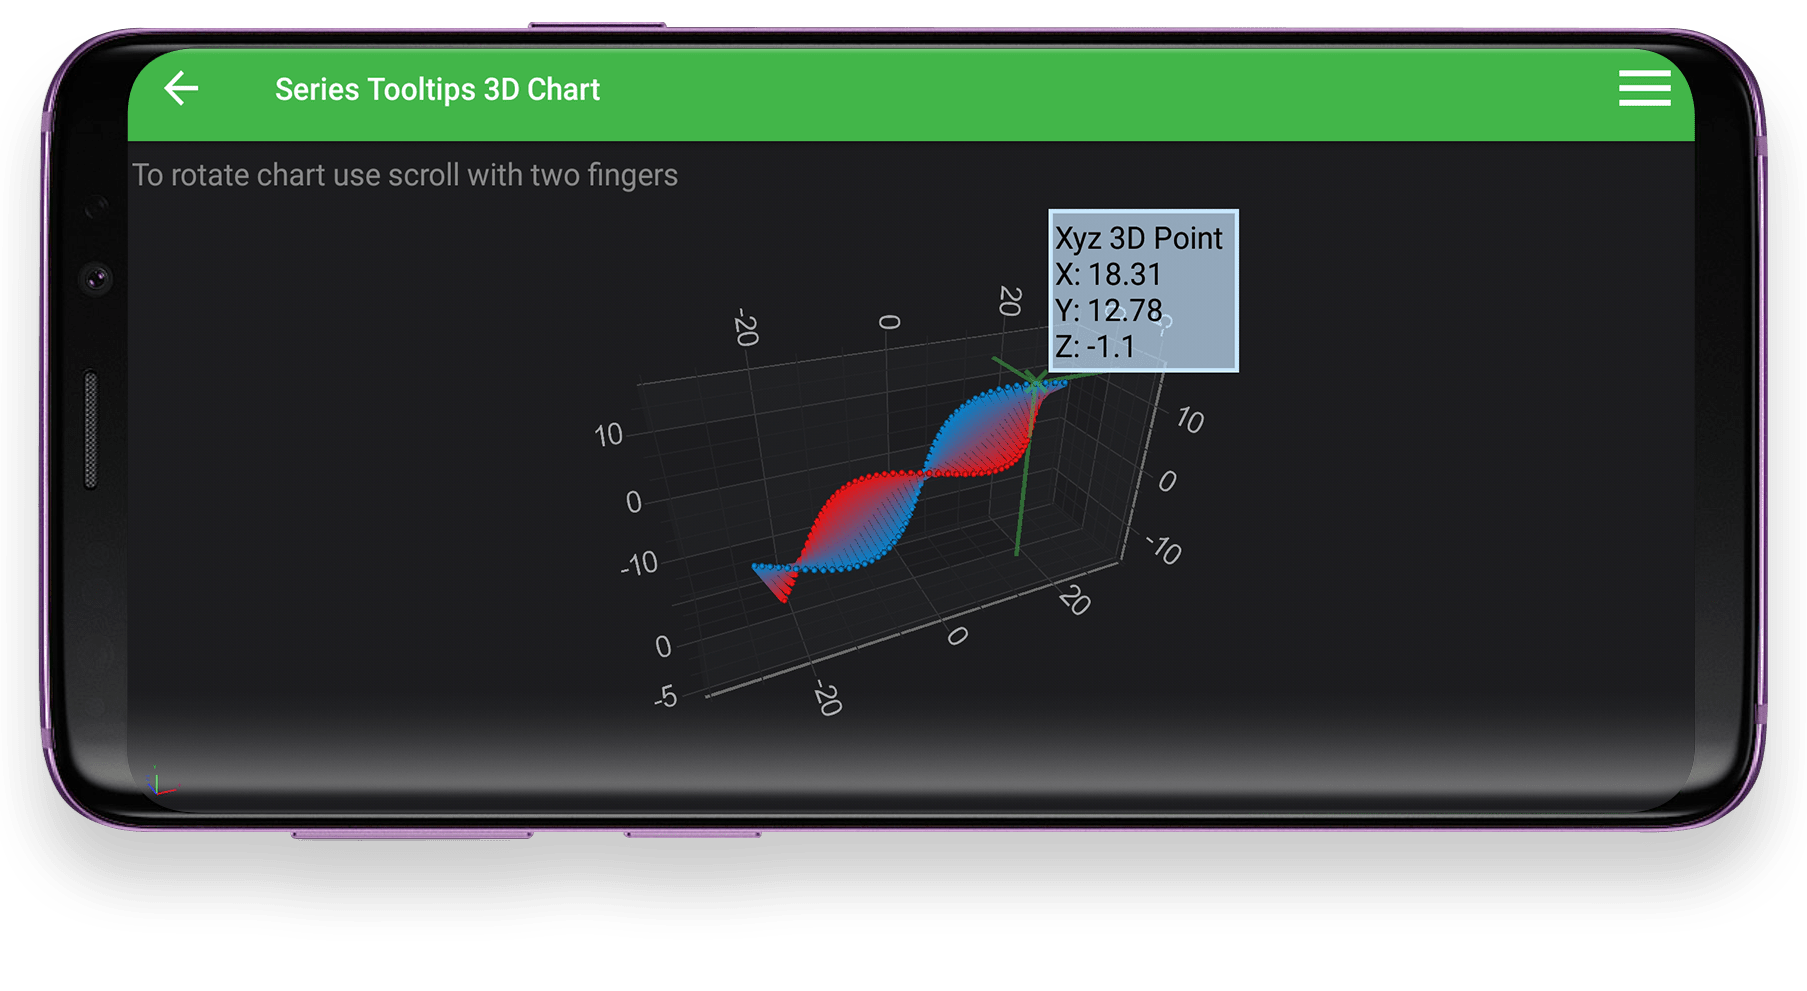
This example demonstrates how to add tooltips to a series on a SciChart Android 3D Charts.
Read more about Tooltip Modifier in Android 3D in SciChart Android documentation or our tutorial on Cursor and Tooltips in 3D.
The full source code for the Android 3D Series Tooltips example is included below (Scroll down!).
Did you know you can also view the source code from one of the following sources as well?
//******************************************************************************
// SCICHART® Copyright SciChart Ltd. 2011-2021. All rights reserved.
//
// Web: http://www.scichart.com
// Support: support@scichart.com
// Sales: sales@scichart.com
//
// SeriesTooltips3DChartFragment.kt is part of SCICHART®, High Performance Scientific Charts
// For full terms and conditions of the license, see http://www.scichart.com/scichart-eula/
//
// This source code is protected by international copyright law. Unauthorized
// reproduction, reverse-engineering, or distribution of all or any portion of
// this source code is strictly prohibited.
//
// This source code contains confidential and proprietary trade secrets of
// SciChart Ltd., and should at no time be copied, transferred, sold,
// distributed or made available without express written permission.
//******************************************************************************
package com.scichart.examples.fragments.examples3d.tooltipsAndHitTest3DCharts.kt
import android.view.LayoutInflater
import com.scichart.charting3d.model.dataSeries.xyz.XyzDataSeries3D
import com.scichart.charting3d.modifiers.CrosshairMode.Lines
import com.scichart.charting3d.visuals.renderableSeries.metadataProviders.PointMetadataProvider3D
import com.scichart.charting3d.visuals.renderableSeries.metadataProviders.PointMetadataProvider3D.PointMetadata3D
import com.scichart.data.model.DoubleRange
import com.scichart.drawing.utility.ColorUtil
import com.scichart.examples.databinding.ExampleSingleChart3dWithModifierTipFragmentBinding
import com.scichart.examples.fragments.base.ExampleBaseFragment
import com.scichart.examples.utils.scichartExtensions.*
import kotlin.math.cos
import kotlin.math.sin
class SeriesTooltips3DChartFragment : ExampleBaseFragment<ExampleSingleChart3dWithModifierTipFragmentBinding>() {
override fun inflateBinding(inflater: LayoutInflater): ExampleSingleChart3dWithModifierTipFragmentBinding {
return ExampleSingleChart3dWithModifierTipFragmentBinding.inflate(inflater)
}
override fun initExample(binding: ExampleSingleChart3dWithModifierTipFragmentBinding) {
val pointMetadataProvider3D = PointMetadataProvider3D()
binding.surface3d.suspendUpdates {
xAxis = numericAxis3D { growBy = DoubleRange(0.2, 0.2); maxAutoTicks = 5 }
yAxis = numericAxis3D { growBy = DoubleRange(0.1, 0.1) }
zAxis = numericAxis3D { growBy = DoubleRange(0.2, 0.2) }
renderableSeries {
pointLineRenderableSeries3D {
xyzDataSeries3D<Double, Double, Double> {
var currentAngle = 0.0
val metadata = pointMetadataProvider3D.metadata
for (i in -SEGMENTS_COUNT until SEGMENTS_COUNT + 1) {
appendPoint(this, -4.0, i.toDouble(), currentAngle)
appendPoint(this, 4.0, i.toDouble(), currentAngle)
metadata.add(PointMetadata3D(blueColor))
metadata.add(PointMetadata3D(redColor))
currentAngle = (currentAngle + rotationAngle) % 360
}
}
spherePointMarker3D { size = 8f }
isLineStrips = false
strokeThickness = 4f
metadataProvider = pointMetadataProvider3D
}
}
chartModifiers {
pinchZoomModifier3D()
orbitModifier3D { receiveHandledEvents = true; executeOnPointerCount = 2 }
zoomExtentsModifier3D()
tooltipModifier3D {
receiveHandledEvents = true
crosshairMode = Lines
crosshairPlanesFill = 0x33FF6600
executeOnPointerCount = 1
}
}
camera {
position(-160f, 190f, -520f)
target(-45f, 150f, 0f)
}
worldDimensions.assign(600f, 300f, 180f)
}
}
private fun appendPoint(ds: XyzDataSeries3D<Double, Double, Double>, x: Double, y: Double, currentAngle: Double) {
val radAngle = Math.toRadians(currentAngle)
val temp = x * cos(radAngle)
val xValue = temp * COS_Y_ANGLE - y * SIN_Y_ANGLE
val yValue = temp * SIN_Y_ANGLE + y * COS_Y_ANGLE
val zValue = x * sin(radAngle)
ds.append(xValue, yValue, zValue)
}
companion object {
private const val SEGMENTS_COUNT = 25
private const val rotationAngle = 360 / 45.0
private val Y_ANGLE = Math.toRadians(-65.0)
private val COS_Y_ANGLE = cos(Y_ANGLE)
private val SIN_Y_ANGLE = sin(Y_ANGLE)
private val blueColor = ColorUtil.argb(0xFF, 0x00, 0x84, 0xCF)
private val redColor = ColorUtil.argb(0xFF, 0xEE, 0x11, 0x10)
}
}
//******************************************************************************
// SCICHART® Copyright SciChart Ltd. 2011-2021. All rights reserved.
//
// Web: http://www.scichart.com
// Support: support@scichart.com
// Sales: sales@scichart.com
//
// SeriesTooltips3DChartFragment.java is part of SCICHART®, High Performance Scientific Charts
// For full terms and conditions of the license, see http://www.scichart.com/scichart-eula/
//
// This source code is protected by international copyright law. Unauthorized
// reproduction, reverse-engineering, or distribution of all or any portion of
// this source code is strictly prohibited.
//
// This source code contains confidential and proprietary trade secrets of
// SciChart Ltd., and should at no time be copied, transferred, sold,
// distributed or made available without express written permission.
//******************************************************************************
package com.scichart.examples.fragments.examples3d.tooltipsAndHitTest3DCharts;
import android.view.LayoutInflater;
import androidx.annotation.NonNull;
import com.scichart.charting3d.model.dataSeries.xyz.XyzDataSeries3D;
import com.scichart.charting3d.modifiers.CrosshairMode;
import com.scichart.charting3d.visuals.SciChartSurface3D;
import com.scichart.charting3d.visuals.axes.NumericAxis3D;
import com.scichart.charting3d.visuals.camera.Camera3D;
import com.scichart.charting3d.visuals.pointMarkers.SpherePointMarker3D;
import com.scichart.charting3d.visuals.renderableSeries.metadataProviders.PointMetadataProvider3D;
import com.scichart.charting3d.visuals.renderableSeries.metadataProviders.PointMetadataProvider3D.PointMetadata3D;
import com.scichart.charting3d.visuals.renderableSeries.pointLine.PointLineRenderableSeries3D;
import com.scichart.core.framework.UpdateSuspender;
import com.scichart.drawing.utility.ColorUtil;
import com.scichart.examples.databinding.ExampleSingleChart3dWithModifierTipFragmentBinding;
import com.scichart.examples.fragments.base.ExampleBaseFragment;
import java.util.List;
public class SeriesTooltips3DChartFragment extends ExampleBaseFragment<ExampleSingleChart3dWithModifierTipFragmentBinding> {
private static final int SEGMENTS_COUNT = 25;
private static final double rotationAngle = 360 / 45d;
private static final double Y_ANGLE = Math.toRadians(-65);
private static final double COS_Y_ANGLE = Math.cos(Y_ANGLE);
private static final double SIN_Y_ANGLE = Math.sin(Y_ANGLE);
private final int blueColor = ColorUtil.argb(0xFF, 0x00, 0x84, 0xCF);
private final int redColor = ColorUtil.argb(0xFF, 0xEE, 0x11, 0x10);
@NonNull
@Override
protected ExampleSingleChart3dWithModifierTipFragmentBinding inflateBinding(@NonNull LayoutInflater inflater) {
return ExampleSingleChart3dWithModifierTipFragmentBinding.inflate(inflater);
}
@Override
protected void initExample(@NonNull ExampleSingleChart3dWithModifierTipFragmentBinding binding) {
final NumericAxis3D xAxis = sciChart3DBuilder.newNumericAxis3D().withGrowBy(.2, .2).withMaxAutoTicks(5).build();
final NumericAxis3D yAxis = sciChart3DBuilder.newNumericAxis3D().withGrowBy(.1, .1).build();
final NumericAxis3D zAxis = sciChart3DBuilder.newNumericAxis3D().withGrowBy(.2, .2).build();
final PointMetadataProvider3D pointMetadataProvider3D = new PointMetadataProvider3D();
final List<PointMetadata3D> metadata = pointMetadataProvider3D.metadata;
final XyzDataSeries3D<Double, Double, Double> dataSeries = new XyzDataSeries3D<>(Double.class, Double.class, Double.class);
double currentAngle = 0d;
for (int i = -SEGMENTS_COUNT; i < SEGMENTS_COUNT + 1; i++) {
appendPoint(dataSeries, -4, i, currentAngle);
appendPoint(dataSeries, 4, i, currentAngle);
metadata.add(new PointMetadata3D(blueColor));
metadata.add(new PointMetadata3D(redColor));
currentAngle = (currentAngle + rotationAngle) % 360;
}
final SpherePointMarker3D pointMarker3D = sciChart3DBuilder.newSpherePointMarker3D()
.withSize(8f)
.build();
final PointLineRenderableSeries3D rs = sciChart3DBuilder.newPointLinesSeries3D()
.withDataSeries(dataSeries)
.withPointMarker(pointMarker3D)
.withIsLineStrips(false)
.withStrokeThicknes(4f)
.withMetadataProvider(pointMetadataProvider3D)
.build();
final SciChartSurface3D surface3d = binding.surface3d;
UpdateSuspender.using(surface3d, () -> {
surface3d.setXAxis(xAxis);
surface3d.setYAxis(yAxis);
surface3d.setZAxis(zAxis);
surface3d.getRenderableSeries().add(rs);
surface3d.getChartModifiers().add(sciChart3DBuilder.newModifierGroup()
.withPinchZoomModifier3D().build()
.withOrbitModifier3D().withReceiveHandledEvents(true).withExecuteOnPointerCount(2).build()
.withZoomExtentsModifier3D().build()
.withTooltipModifier()
.withReceiveHandledEvents(true)
.withCrosshairMode(CrosshairMode.Lines)
.withCrosshairPlanesFill(0x33FF6600)
.withExecuteOnPointerCount(1)
.build()
.build());
surface3d.getWorldDimensions().assign(600, 300, 180);
surface3d.getCamera().getPosition().assign(-160, 190, -520);
surface3d.getCamera().getTarget().assign(-45, 150, 0);
});
}
private void appendPoint(XyzDataSeries3D<Double, Double, Double> ds, double x, double y, double currentAngle) {
final double radAngle = Math.toRadians(currentAngle);
final double temp = x * Math.cos(radAngle);
final double xValue = temp * COS_Y_ANGLE - y * SIN_Y_ANGLE;
final double yValue = temp * SIN_Y_ANGLE + y * COS_Y_ANGLE;
final double zValue = x * Math.sin(radAngle);
ds.append(xValue, yValue, zValue);
}
}