Animations API Fundamentals
In SciChart.js you can use the Animations API to animate RenderableSeries (Chart Types). The Animations API allows you to define a number of different transforms you your chart series during the render pass.
Additionally there are Generic Animations, which are run on the SciChartSurface rather than a particular series, and can be coded to animate almost anything, such as annotations, data, and even things outside the chart.
The reset of this page introduces Series Animations.
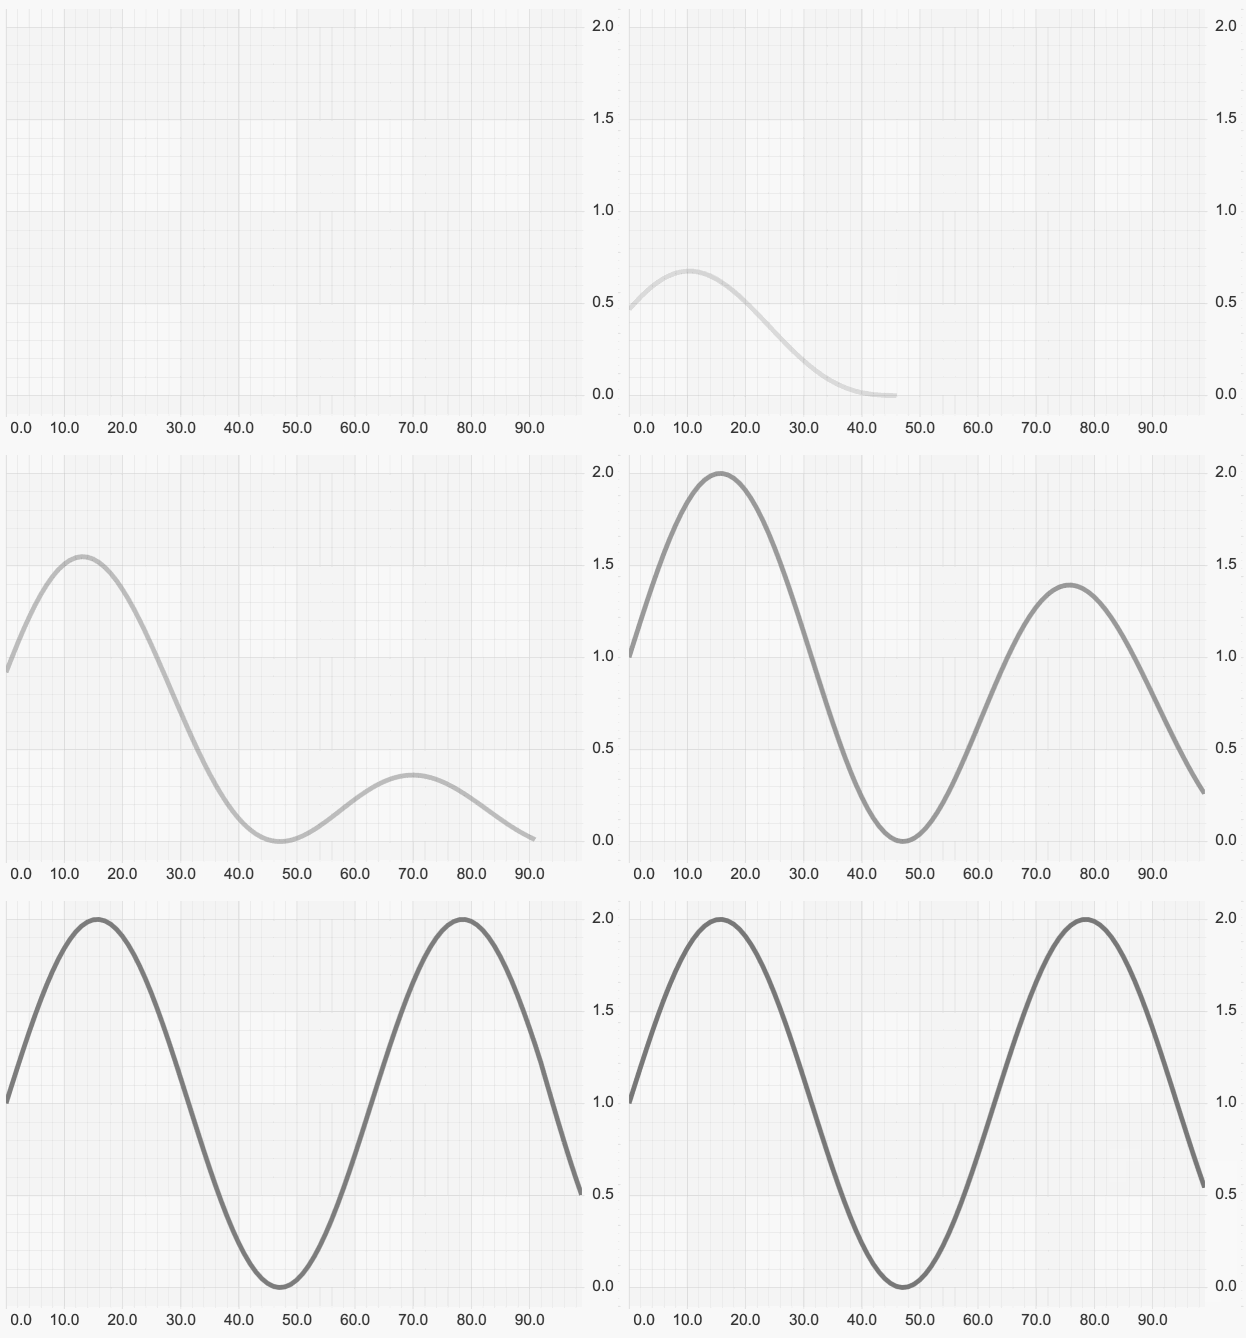
For example. here is a Wave startup animation:

Types of Animation in SciChart.js
There are three types of series animations in the SciChart.js library:
- A start-up animation, which runs on start (when a series is shown)
- A style animation, which animates style properties like stroke, strokeThickness and fill
- A dataset animation, which animates changing data.
Articles above cover these animation types and give you examples of how to use them.
Running or Queueing an Animation
The API to run any of those animations is the same.
You can either run an animation immediately, or add it to the queue.
Adding Animations to the Queue
Internally each renderable series has an animation queue which allows chaining animations. In order to add an animation to the queue call enqueueAnimation:
Running an Animation Right Away
If there is a need to cancel all already running animations and run another animation use runAnimation method, or, alternatively setting the BaseRenderableSeries.animation property or passing the animation to the series constructor.
See the articles in the See Also section below for examples of how to use the different animation types.
