SciChart.js JavaScript 2D Charts API > Styling and Theming > Chart Styling - Theming of Wait Loader
Chart Styling - Theming of Wait Loader

When SciChart.js starts up, a short wait-loader is shown as your server downloads Wasm (webassembly) files and asynchronously initializes our high performance WebGL Graphics engine.

The wait time is a one-off cost when the page loads, and once WebAssembly files have been cached by your browser, subsequent loads are very fast.

We show a wait-loader screen in SciChart.js which can be fully customized to match the styling of your app.

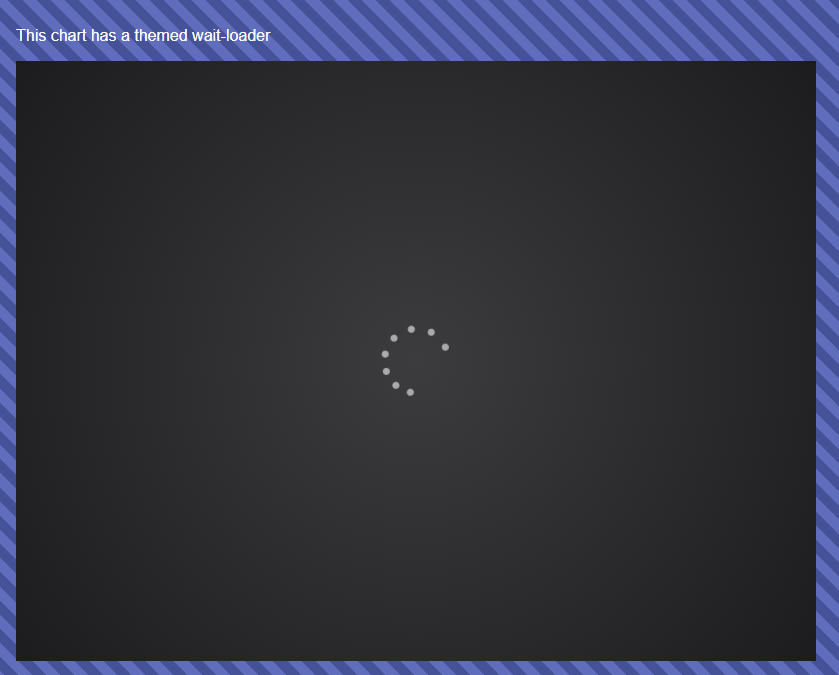
Default Wait Loader Styling

The Wait Loader picks up its styling from the theme. Since the default theme is SciChartJSDarkv2Theme the wait loader will have a dark background with light foreground.

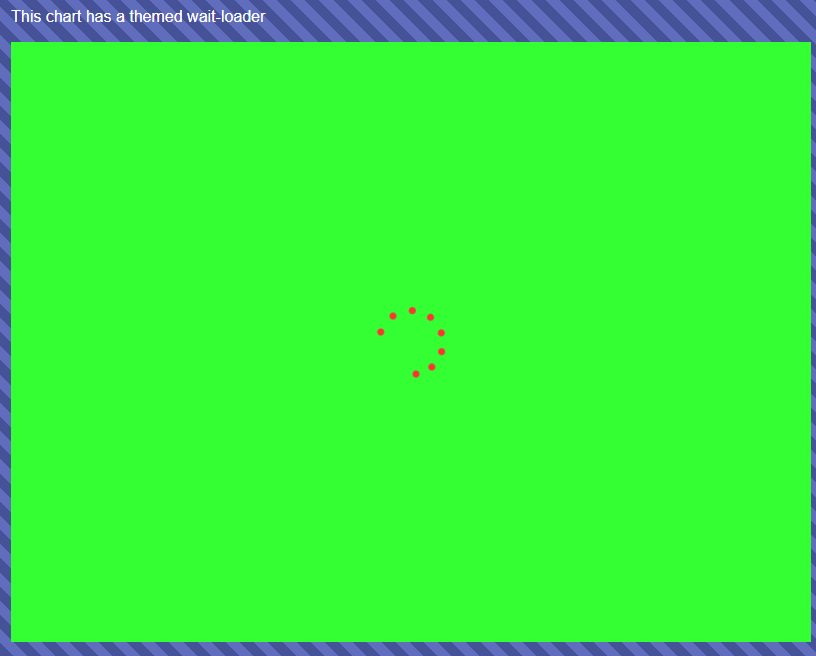
Setting Wait Loader Foreground/Background Color

You can customize the wait loader foreground and background. To do this, set the IThemeProvider.loadingAnimationBackground and IThemeProvider.loadingAnimationForeground properties. This theme must then be passed into the constructor options of SciChartSurface.create, as the loader is shown before asynchronous creation of the chart.

import {SciChartSurface} from "scichart/Charting/Visuals/SciChartSurface";
import {NumericAxis} from "scichart/Charting/Visuals/Axis/NumericAxis";
import {SciChartJSDarkv2Theme} from "scichart/Charting/Themes/SciChartJSDarkv2Theme";

// Create a theme based on another theme
const theme = {... new SciChartJSDarkv2Theme()};

// Set loading Animation foreground / background colours
theme.loadingAnimationForeground = "#ff3333"; // Red
theme.loadingAnimationBackground = "#33ff33"; // Green
// Must pass theme to create options on SciChartSurface so it's shown before creation
const { sciChartSurface, wasmContext } = await SciChartSurface.create(divId,{ theme });

Customizing Wait Loader HTML

Further customization of the wait loader is possible by implementing a chart loader. You need to create a calss which confirms to the ISciChartLoader interface and implement addChartLoader() and removeChartLoader() functions. This will let you put anything in the chart loader, for example images, a company logo or animations.

Here's an example below:

import {SciChartSurface} from "scichart/Charting/Visuals/SciChartSurface";
import {NumericAxis} from "scichart/Charting/Visuals/Axis/NumericAxis";
import {SciChartJSDarkv2Theme} from "scichart/Charting/Themes/SciChartJSDarkv2Theme";
export async function waitLoaderThemeing(divId) {
    const loader = new CustomChartLoader();
    const theme = new SciChartJSDarkv2Theme();
    const { sciChartSurface, wasmContext } = await SciChartSurface.create(divId,{ loader, theme });
    sciChartSurface.xAxes.add(new NumericAxis(wasmContext));
    sciChartSurface.yAxes.add(new NumericAxis(wasmContext));
}
export class CustomChartLoader {
    addChartLoader(domChartRoot, theme) {
        const loaderContainerDiv = document.createElement("div");
        loaderContainerDiv.style.backgroundColor = "#0F151C";
        loaderContainerDiv.style.height = "100%";
        loaderContainerDiv.style.width = "100%";
        loaderContainerDiv.style.display = "flex";
        loaderContainerDiv.style.justifyContent = "center";
        loaderContainerDiv.style.alignItems = "center";
        const loaderImage = document.createElement("img");
        loaderImage.src = "https://i.giphy.com/media/2WjpfxAI5MvC9Nl8U7/giphy.webp";
        loaderContainerDiv.appendChild(loaderImage);
        const loaderText = document.createElement("div");
        loaderText.style.marginLeft = "auto";
        loaderText.style.marginRight = "auto";
        loaderText.style.float = "left";
        loaderText.style.bottom = "150px";
        loaderText.style.textAlign = "center";
        loaderText.style.position = "absolute";
        loaderText.innerHTML = "Initializing the Awesomeness...";
        loaderText.style.color = "#FF6600";
        loaderText.style.fontFamily = "Arial";
        loaderContainerDiv.appendChild(loaderText);
        domChartRoot.appendChild(loaderContainerDiv);
        return loaderContainerDiv;
    }
    removeChartLoader(domChartRoot, loaderElement) {
        // Remove loader after 2000ms timeout
        setTimeout(() => domChartRoot.removeChild(loaderElement), 100000);
        // For instant removal once scichart has loaded, just call domChartRoot.removeChild(loaderElement) without the setTimeout
        // e.g.
        // domChartRoot.removeChild(loaderElement);
    }
}
import {SciChartSurface} from "scichart/Charting/Visuals/SciChartSurface";
import {NumericAxis} from "scichart/Charting/Visuals/Axis/NumericAxis";
import {ISciChartLoader} from "scichart/Charting/Visuals/loader";
import {IThemeProvider} from "scichart/Charting/Themes/IThemeProvider";
import {SciChartJSDarkv2Theme} from "scichart/Charting/Themes/SciChartJSDarkv2Theme";
export async function waitLoaderThemeingTs(divId: string) {
    const loader = new CustomChartLoader();
    const theme = new SciChartJSDarkv2Theme();
    const { sciChartSurface, wasmContext } = await SciChartSurface.create(divId,{ loader, theme });
    sciChartSurface.xAxes.add(new NumericAxis(wasmContext));
    sciChartSurface.yAxes.add(new NumericAxis(wasmContext));
}
export class CustomChartLoader implements ISciChartLoader {
    public type: "Custom";
    public loadingText: string = "Initializing the Awesomeness...";
    constructor(options?: { loadingText?: string }) {
        this.loadingText = options?.loadingText ?? this.loadingText;
    }
    public addChartLoader(domChartRoot: HTMLDivElement, theme: IThemeProvider): HTMLElement {
        const loaderContainerDiv = document.createElement("div");
        loaderContainerDiv.style.backgroundColor = "#0F151C";
        loaderContainerDiv.style.height = "100%";
        loaderContainerDiv.style.width = "100%";
        loaderContainerDiv.style.display = "flex";
        loaderContainerDiv.style.justifyContent = "center";
        loaderContainerDiv.style.alignItems = "center";
        const loaderImage = document.createElement("img") as HTMLImageElement;
        loaderImage.src = "https://i.giphy.com/media/2WjpfxAI5MvC9Nl8U7/giphy.webp";
        loaderContainerDiv.appendChild(loaderImage);
        const loaderText = document.createElement("div");
        loaderText.style.marginLeft = "auto";
        loaderText.style.marginRight = "auto";
        loaderText.style.float = "left";
        loaderText.style.bottom = "150px";
        loaderText.style.textAlign = "center";
        loaderText.style.position = "absolute";
        loaderText.innerHTML = this.loadingText;
        loaderText.style.color = "#FF6600";
        loaderText.style.fontFamily = "Arial";
        loaderContainerDiv.appendChild(loaderText);
        domChartRoot.appendChild(loaderContainerDiv);
        return loaderContainerDiv;
    }
    public removeChartLoader(domChartRoot: HTMLDivElement, loaderElement: HTMLElement): void {
        // Remove loader after 2000ms timeout
        setTimeout(() => domChartRoot.removeChild(loaderElement), 100000);
        // For instant removal once scichart has loaded, just call domChartRoot.removeChild(loaderElement) without the setTimeout
        // e.g.
        // domChartRoot.removeChild(loaderElement);
    }
}


This results in the following output.

The wait loader accepts HTML into the DOM. You could make stunning wait screens to match your app using Videos, Gifs, Webp images or animated SVG with a little creativity and input from a UX Designer

Awaiting multiple charts for synchronized Chart Loaders

Here's a tip if you have multiple charts in your application. Use Promise.AwaitAll for the all the SciChartSurface.create() calls you make. This will ensure all waitloaders start and end at the same time.

Conclusion

So you can see now that SciChart.js supports several options for styling the chart wait-loader, to allow charts to fit in with your application theme.

See also our documentation below on styling & themeing, including colouring chart parts and creating custom themes.


See Also