
Creating a Series with the Builder API
Let’s add a series. A definition must have a type property which is an ESeriesType. We’ll go into options in more detail later. The data property tells us the shape of data we need. There are a few different ways to supply data, but the simplest is to set the values directly here.
| Example Title |
Copy Code
|
|---|---|
import { chartBuilder } from "scichart/Builder/chartBuilder";
import { ESeriesType } from "scichart/types/SeriesType";
const { sciChartSurface, wasmContext } = await chartBuilder.buildChart(divElementId, {
series: {
type: ESeriesType.LineSeries,
xyData: {
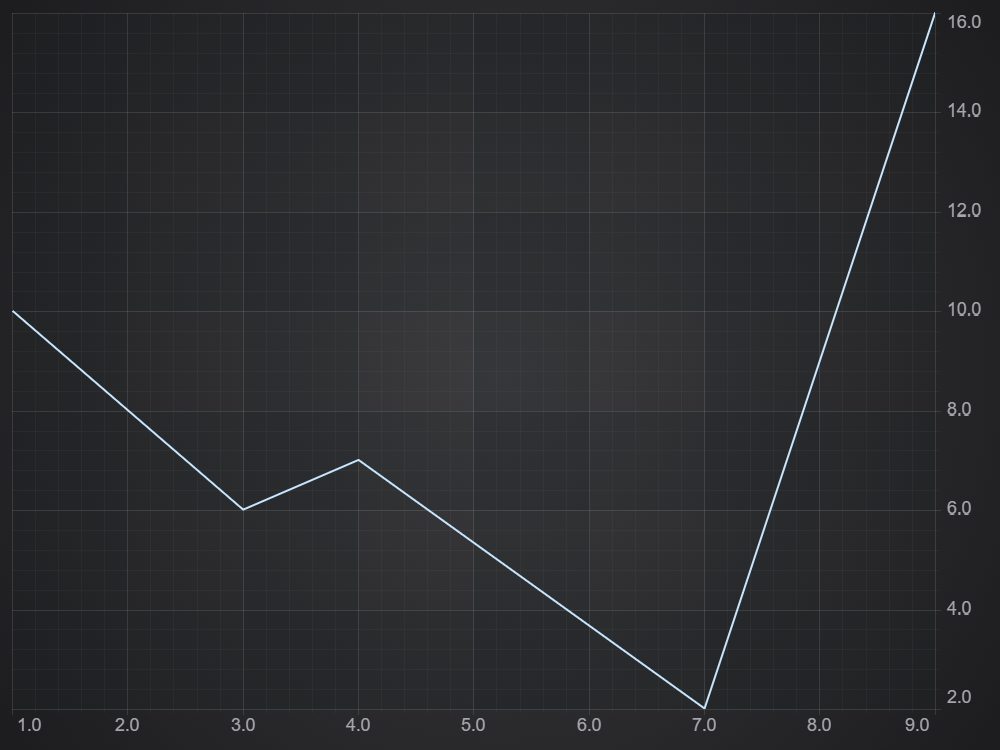
xValues: [1, 3, 4, 7, 9],
yValues: [10, 6, 7, 2, 16]
}
}
});
|
|
This is all we need for a working SciChart chart.
Notice that the return type of the chartBuilder.buildChart() function call is a Promise, which returns SciChartSurface and wasmContext just like a call to SciChartSurface.create(), except it will already be populated with series, default axis and data provided in the builder options.
Run the code sample above and you will get this output:
Customizing Axis, Theme and Modifiers with the Builder API
To customise the axes you again need to specify the axis type, then you can set options. The theme can be set in the surface. The theme can be a full theme class, or you can just refer to it by type.
Use the following code sample to try these out:
| Example Title |
Copy Code
|
|---|---|
import { chartBuilder } from "scichart/Builder/chartBuilder";
import { EThemeProviderType } from "scichart/types/ThemeProviderType";
import { EAxisType } from "scichart/types/AxisType";
import { EChart2DModifierType } from "scichart/types/ChartModifierType";
import { ESeriesType } from "scichart/types/SeriesType";
import { NumberRange } from "scichart/Core/NumberRange";
// ...
const { sciChartSurface, wasmContext } = await chartBuilder.buildChart(divElementId, {
    surface: {
        theme: {
            type: EThemeProviderType.Light
        }
    },
    series: {
        type: ESeriesType.LineSeries,
        options: { stroke: "blue" },
        xyData: {
            xValues: [1, 3, 4, 7, 9],
            yValues: [10, 6, 7, 2, 16]
        }
    },
    yAxes: {
        type: EAxisType.NumericAxis,
        options: {
            axisTitle: "Number of things",
            visibleRange: new NumberRange(0, 20),
            labelPrecision: 0
        }
    },
    modifiers: [
        { type: EChart2DModifierType.Rollover },
        { type: EChart2DModifierType.ZoomPan }
    ]
});
|
|
This results in the following chart output:
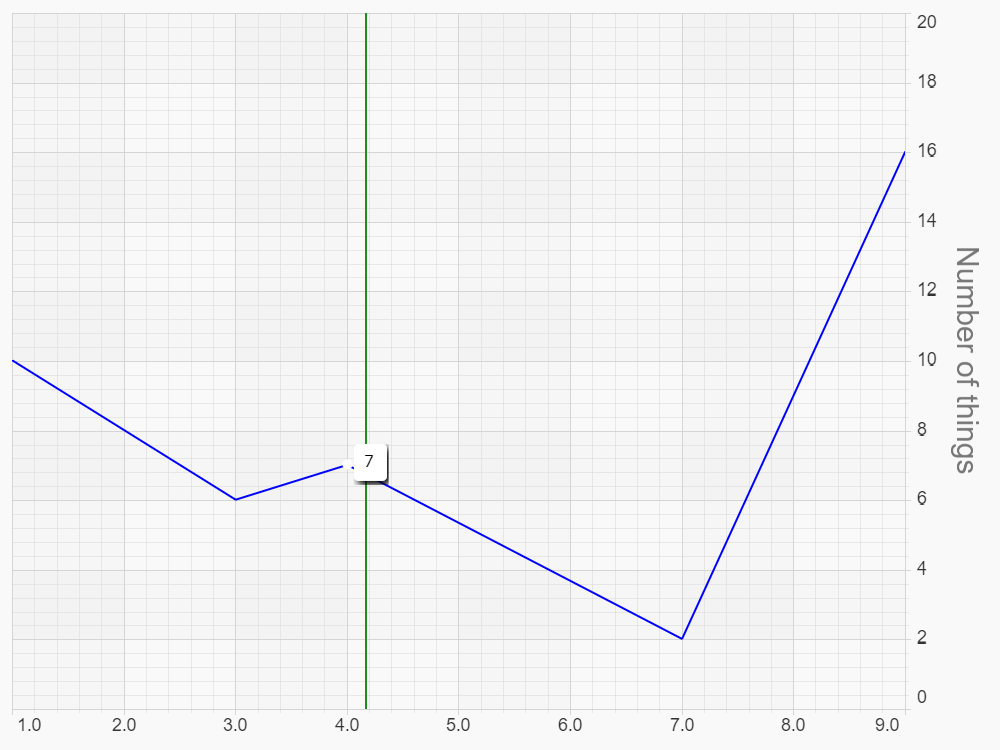
Chart Modifiers, like pretty much everything, are `{ type, options }`. Note that series, axes, annotations and modifiers can all be a single definition, or an array.