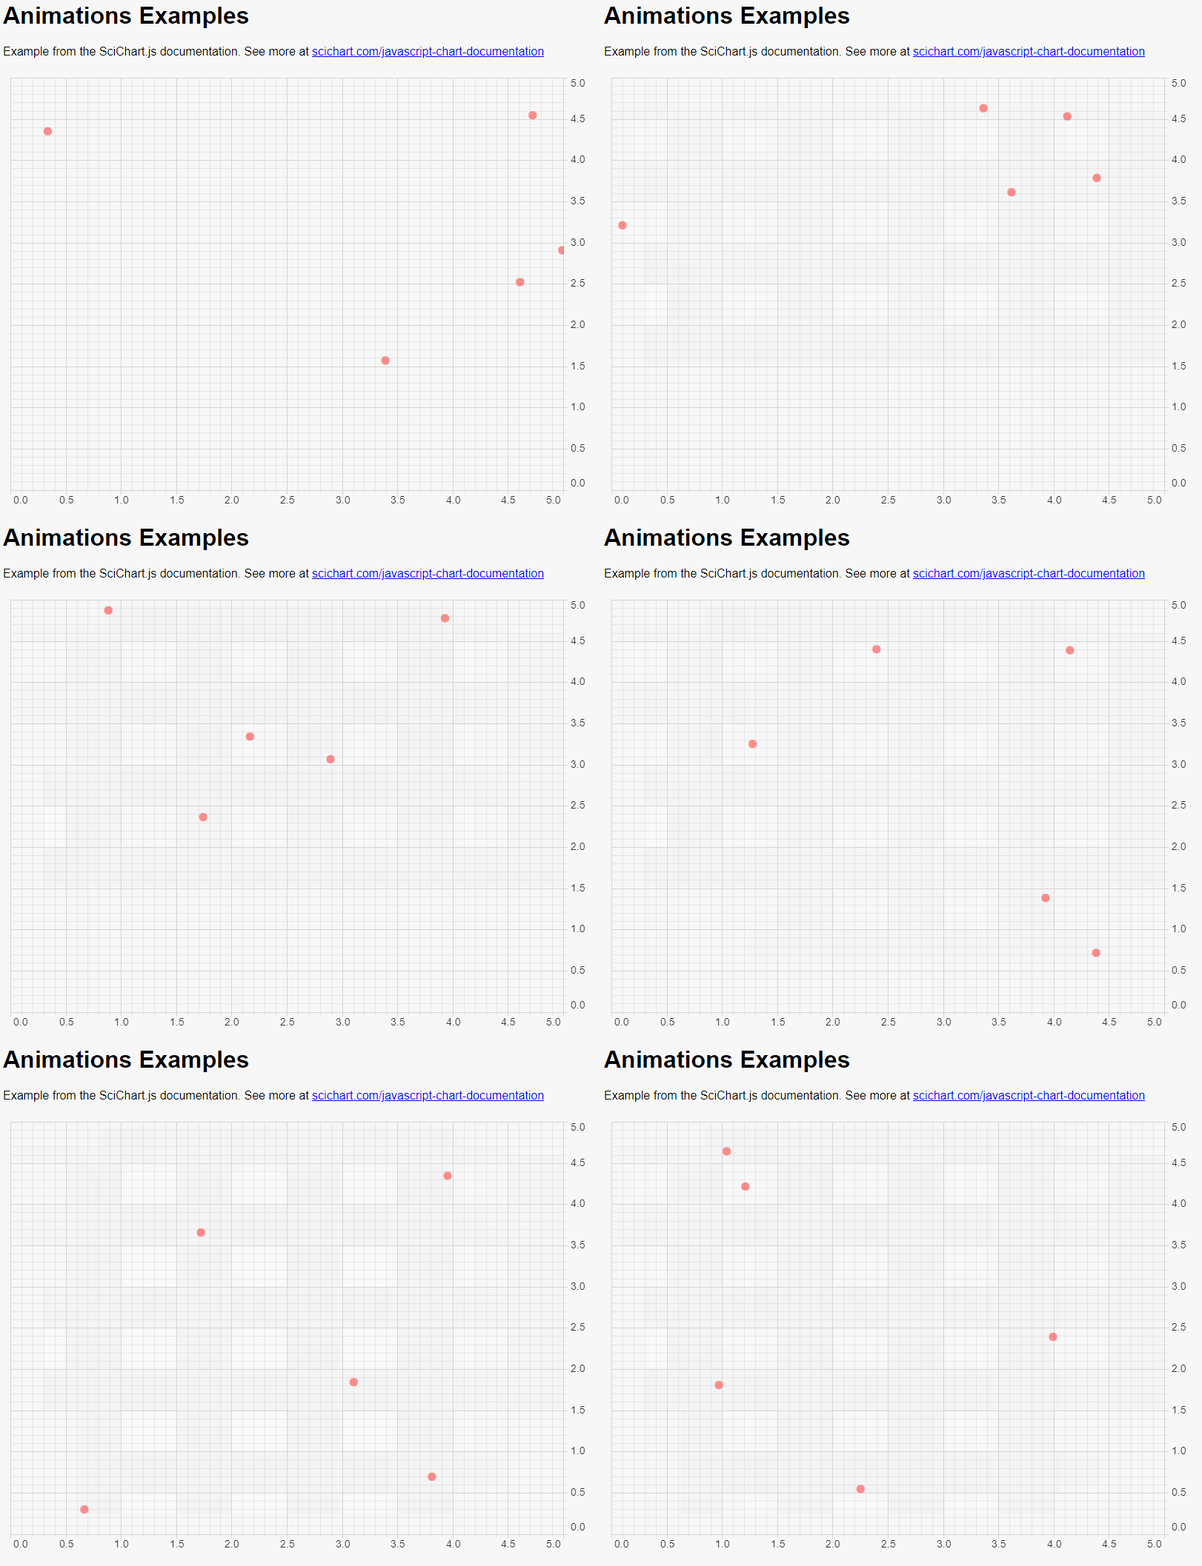
SciChart.js v2.x and above features a new API which allows you to animate between datasets on a chart. But the limitation is that the length of data vectors (length of X and Y values and animation values) must be the same.
Below find an example of animating between two different datasets. Note the Animation type includes style properties and is a specific animation type for the series, as per our Style Transition Animations documentation.
Worked Examples
Animating Data in a Scatter Series
You can animate the dataset in a scatter series by using the ScatterAnimation type. This allows you to set new data and animate to the new position. Find an example below:
import {SciChartSurface} from "scichart/Charting/Visuals/SciChartSurface";
import {NumericAxis} from "scichart/Charting/Visuals/Axis/NumericAxis";
import {EllipsePointMarker} from "scichart/Charting/Visuals/PointMarkers/EllipsePointMarker";
import {XyDataSeries} from "scichart/Charting/Model/XyDataSeries";
import {NumberRange} from "scichart/Core/NumberRange";
import {XyScatterRenderableSeries} from "scichart/Charting/Visuals/RenderableSeries/XyScatterRenderableSeries";
import {SciChartJSLightTheme} from "scichart/Charting/Themes/SciChartJSLightTheme";
import {ScatterAnimation} from "scichart/Charting/Visuals/RenderableSeries/Animations/ScatterAnimation";
import { easing} from "scichart/Core/Animations/EasingFunctions";
export async function scatterDataAnimation(divId) {
    const { sciChartSurface, wasmContext } = await SciChartSurface.create(divId, {
        theme: new SciChartJSLightTheme()
    });
    sciChartSurface.xAxes.add(new NumericAxis(wasmContext, { visibleRange: new NumberRange(0, 5) }));
    sciChartSurface.yAxes.add(new NumericAxis(wasmContext, { visibleRange: new NumberRange(0, 5) }));
    // Create a scatter series with some initial data
    const scatterSeries = new XyScatterRenderableSeries(wasmContext, {
        dataSeries: new XyDataSeries(wasmContext, {
            xValues: [1, 2, 3, 4, 5],
            yValues: [1.3, 2.3, 4, 3.3, 4.5]
        }),
        pointMarker: new EllipsePointMarker(wasmContext, {
            width: 11, height: 11, fill: "#FF3333BB", strokeThickness: 0
        })
    });
    sciChartSurface.renderableSeries.add(scatterSeries);
    // create a temp series for passing animation values
    const animationSeries = new XyDataSeries(wasmContext);
    // register this so it is deleted along with the main surface
    sciChartSurface.addDeletable(animationSeries);
    // Update data using data animations
    const animateData = () => {
        const xValues = Array.from({length: 5}, () => Math.random() * 5);
        const yValues = Array.from({length: 5}, () => Math.random() * 5);
        // Set the values on the temp series
        animationSeries.clear();
        animationSeries.appendRange(xValues, yValues);
        scatterSeries.runAnimation(new ScatterAnimation({
            duration: 500,
            ease: easing.outQuad,
            // Do not create a new DataSeries here or it will leak and eventually crash.
            dataSeries: animationSeries
        }));
        setTimeout(animateData, 1000);
    };
    setTimeout(animateData, 1000);
}

Combining Style and Data Animations
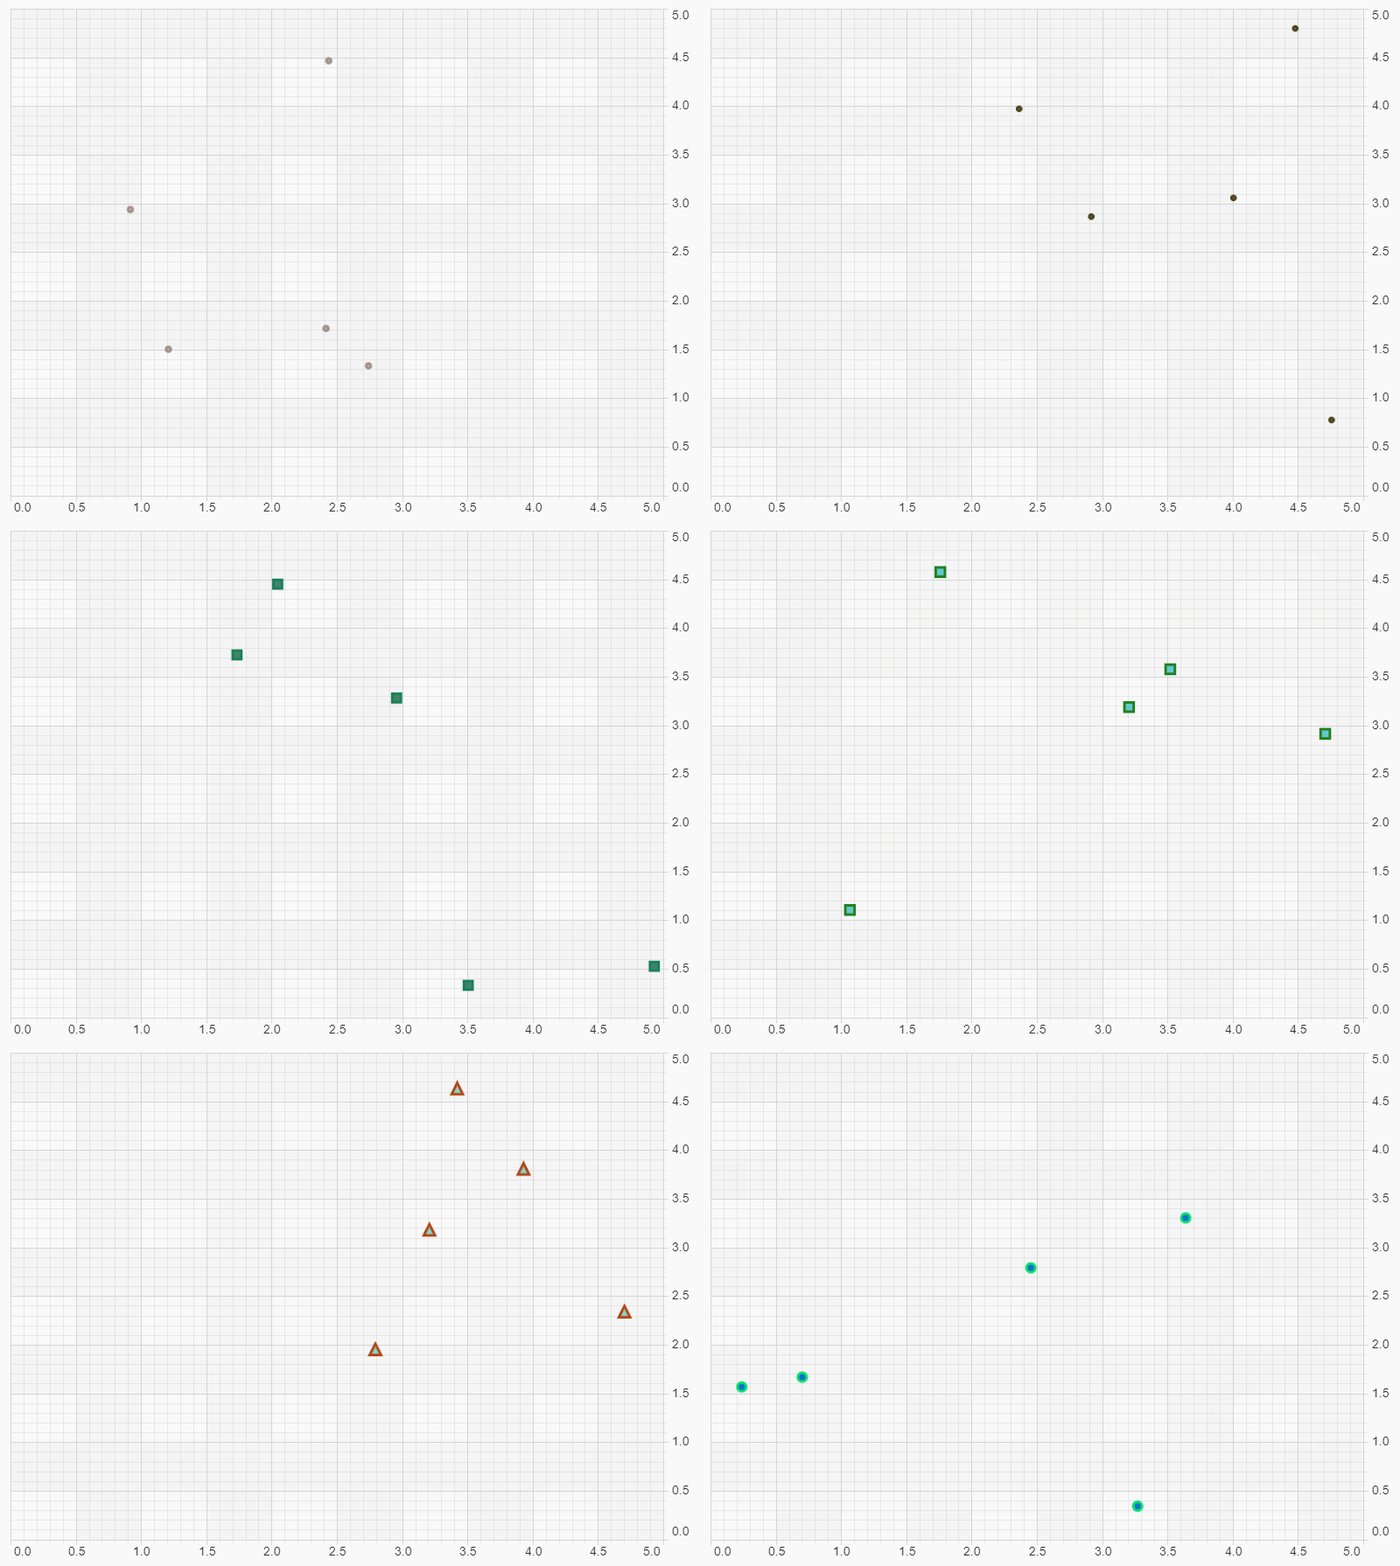
You can take the example above a step further and combine both style and data animations. Remember the constraint that datasets need the same amount of X,Y datapoints before and after. If this condition is met, you can achieve something like this:
import {SciChartSurface} from "scichart/Charting/Visuals/SciChartSurface";
import {NumericAxis} from "scichart/Charting/Visuals/Axis/NumericAxis";
import {EllipsePointMarker} from "scichart/Charting/Visuals/PointMarkers/EllipsePointMarker";
import {XyDataSeries} from "scichart/Charting/Model/XyDataSeries";
import {NumberRange} from "scichart/Core/NumberRange";
import {XyScatterRenderableSeries} from "scichart/Charting/Visuals/RenderableSeries/XyScatterRenderableSeries";
import {SciChartJSLightTheme} from "scichart/Charting/Themes/SciChartJSLightTheme";
import {ScatterAnimation} from "scichart/Charting/Visuals/RenderableSeries/Animations/ScatterAnimation";
import { easing} from "scichart/Core/Animations/EasingFunctions";
import {EPointMarkerType} from "scichart/types/PointMarkerType";
export async function scatterDataAnimationWithStyle(divId) {
    const { sciChartSurface, wasmContext } = await SciChartSurface.create(divId, {
        theme: new SciChartJSLightTheme()
    });
    sciChartSurface.xAxes.add(new NumericAxis(wasmContext, { visibleRange: new NumberRange(0, 5) }));
    sciChartSurface.yAxes.add(new NumericAxis(wasmContext, { visibleRange: new NumberRange(0, 5) }));
    // Create a scatter series with some initial data
    const scatterSeries = new XyScatterRenderableSeries(wasmContext, {
        dataSeries: new XyDataSeries(wasmContext, {
            xValues: [1, 2, 3, 4, 5],
            yValues: [1.3, 2.3, 4, 3.3, 4.5]
        }),
        pointMarker: new EllipsePointMarker(wasmContext, {
            width: 11, height: 11, fill: "#FF3333BB", strokeThickness: 0
        })
    });
    sciChartSurface.renderableSeries.add(scatterSeries);
    // create a temp series for passing animation values
    const animationSeries = new XyDataSeries(wasmContext);
    // register this so it is deleted along with the main surface
    sciChartSurface.addDeletable(animationSeries);
    // Update data using data animations
    const animateDataAndStyle = () => {
        const xValues = Array.from({length: 5}, () => Math.random() * 5);
        const yValues = Array.from({length: 5}, () => Math.random() * 5);
        const randomColor = () => '#'+(0x1000000+Math.random()*0xffffff).toString(16).substr(1,6);
        const fillColor = randomColor();
        const strokeColor = randomColor();
        const size = Math.random() * 12 + 5;
        const pointMarkers = [EPointMarkerType.Ellipse, EPointMarkerType.Triangle, EPointMarkerType.Square];
        const randomMarker = () => pointMarkers[Math.floor(Math.random() * 3)];
        // Set the values on the temp series
        animationSeries.clear();
        animationSeries.appendRange(xValues, yValues);
        scatterSeries.runAnimation(new ScatterAnimation({
            duration: 500,
            ease: easing.outQuad,
            styles: {
                pointMarker: {
                    type: randomMarker(),
                    width: size,
                    height: size,
                    strokeThickness: 3,
                    stroke: strokeColor,
                    fill: fillColor
                }
            },
            // Do not create a new DataSeries here or it will leak and eventually crash.
            dataSeries: animationSeries
        }));
        setTimeout(animateDataAndStyle, 1000);
    };
    setTimeout(animateDataAndStyle, 1000);
}

Animating Data in a Column Series
const { sciChartSurface, wasmContext } = await SciChartSurface.create(divElementId, {
    theme: new SciChartJSLightTheme()
});
sciChartSurface.xAxes.add(new NumericAxis(wasmContext));
sciChartSurface.yAxes.add(new NumericAxis(wasmContext));
const columnSeries = new FastColumnRenderableSeries(wasmContext, {
    fill: "rgba(176, 196, 222, 1)",
    stroke: "#4682b4",
    strokeThickness: 2,
    dataPointWidth: 0.5,
    opacity: 0.7
});
sciChartSurface.renderableSeries.add(columnSeries);
const dataSeries = new XyDataSeries(wasmContext);
for (let i = 0; i < 20; i++) {
    dataSeries.append(i, Math.sin(i * 0.5));
}
columnSeries.dataSeries = dataSeries;
const dataSeries1 = new XyDataSeries(wasmContext);
for (let i = 0; i < 20; i++) {
    dataSeries1.append(5 + i / 2, Math.cos(i * 0.5));
}
// register this so it is deleted along with the main surface
sciChartSurface.addDeletable(dataSeries1 );

columnSeries.runAnimation(
    new ColumnAnimation({
        duration: 3000,
        dataSeries: dataSeries1
    })
);
sciChartSurface.zoomExtents();
return { wasmContext, sciChartSurface };
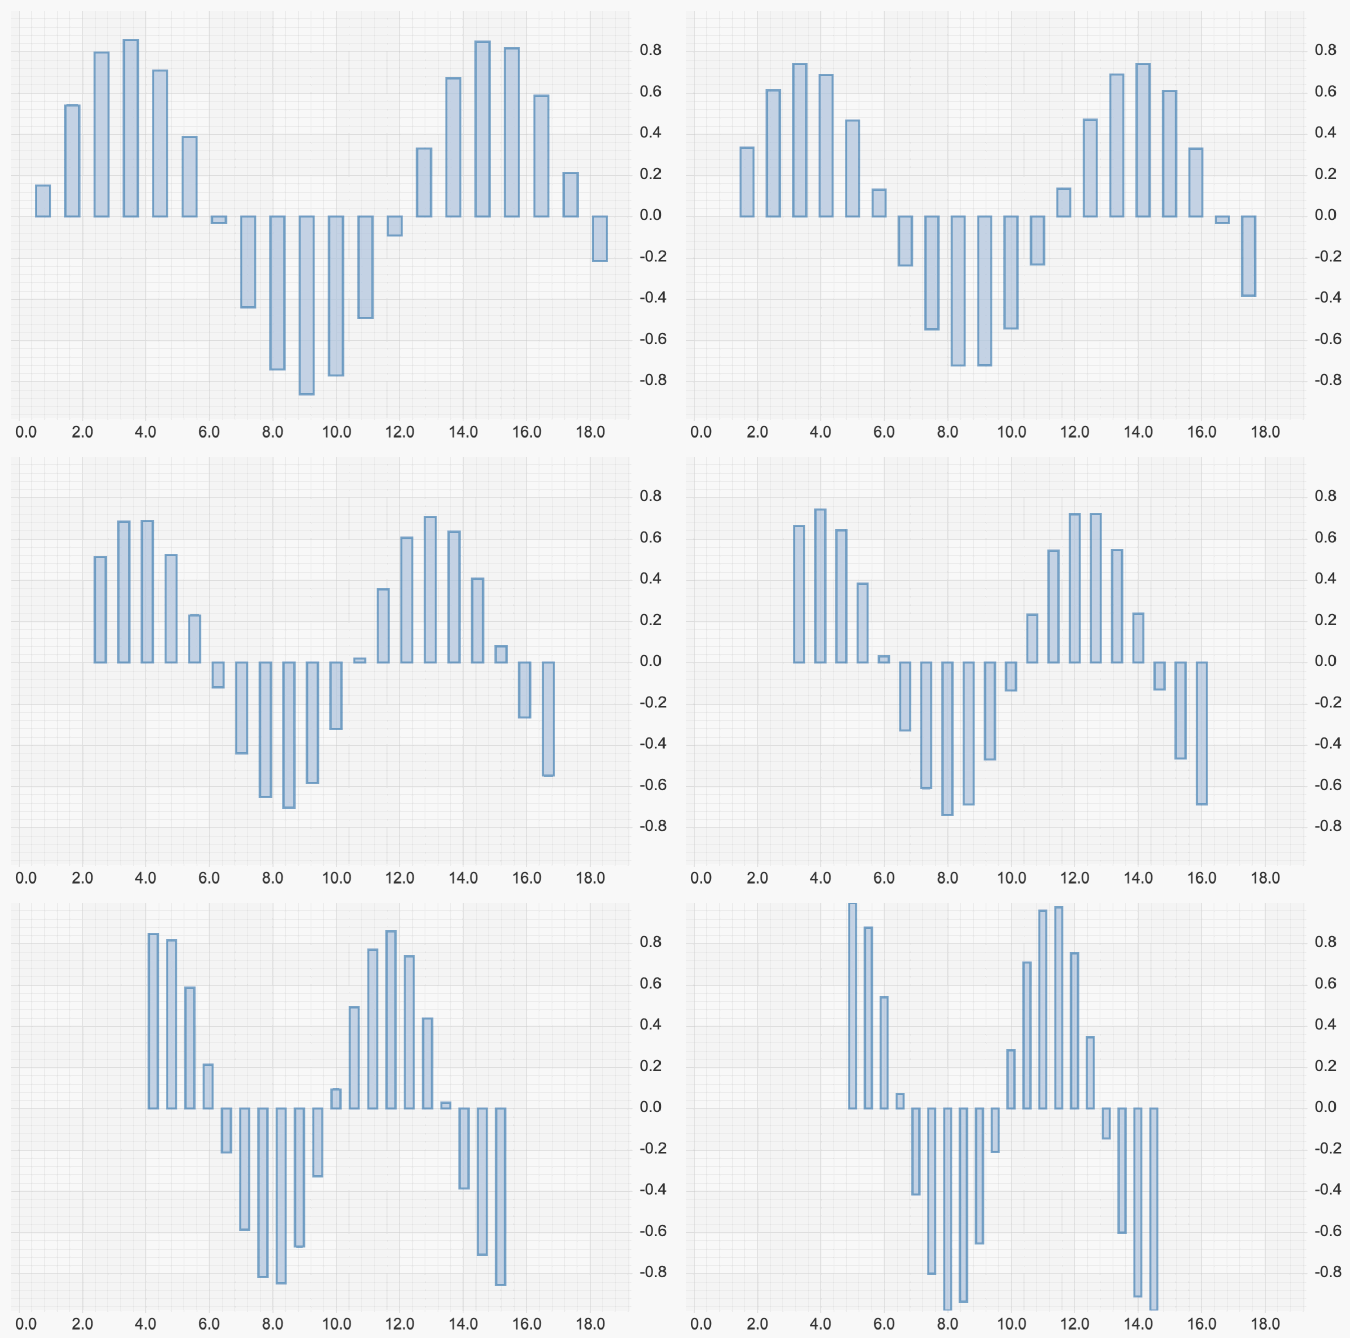
Below is the result.

