
Glow and DropShadow Shader Effects
SciChart.js features WebGL shader-based GlowEffect and ShadowEffect effects which may be added onto chart types throughout our library.
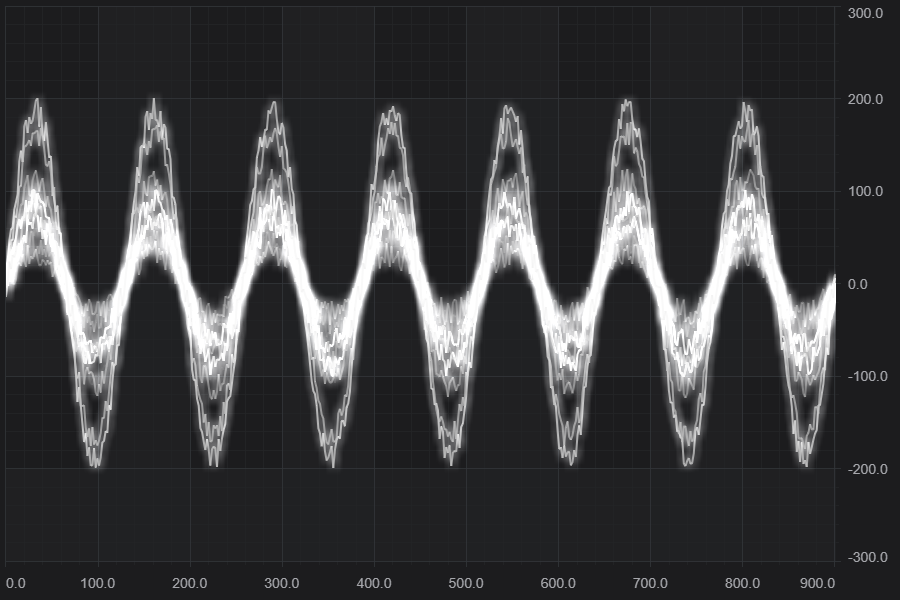
Above: WebGL GlowEffect added to the Real-time Ghosted Traces example
Adding Glow Effects to Series
A glow shader effect can be added to series to give it an oscilloscope / VDU style effect.
| GlowEffect example |
Copy Code
|
|---|---|
import { GlowEffect } from "scichart/Charting/Visuals/RenderableSeries/GlowEffect";
import { Point } from "scichart/Core/Point";
import { FastLineRenderableSeries } from "scichart/Charting/Visuals/RenderableSeries/FastLineRenderableSeries";

sciChartSurface.renderableSeries.add(
    new FastLineRenderableSeries(wasmContext, {
        strokeThickness: 2,
        stroke: "#FFFF00",
        effect: new GlowEffect(wasmContext, {
            range: 0,
            intensity: 1,
            color: "#333333",
            offset: new Point(10, 10)
        })
    })
);
|
|
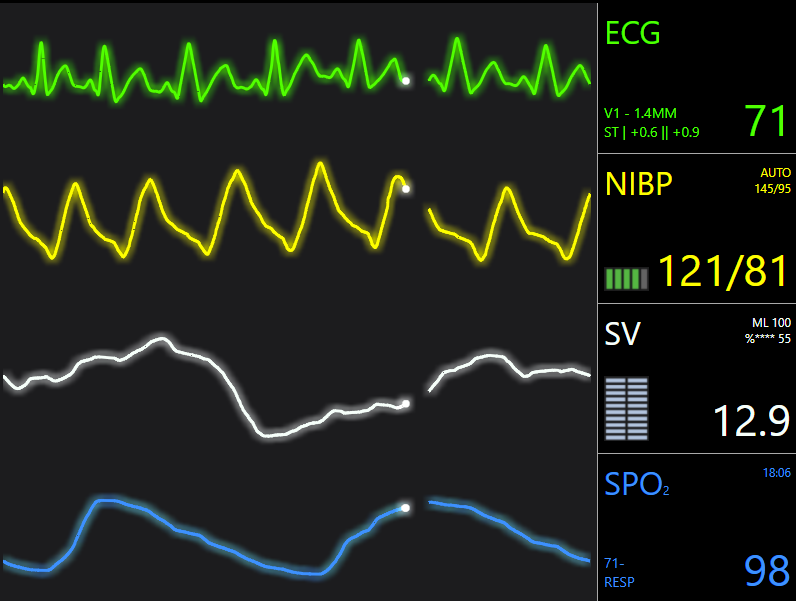
This results in the following (visible in the Vital Signs monitor example).
Adding Shadow Effect to Series
Drop-shadow effects are also in development, and an example will be provided soon.