The Builder API is a new API to SciChart.js v2. In addition to programmatically creating charts with JavaScript or TypeScript code, you can now create charts with a JSON-object API, either with objects in code with discovererable intellisense, or with JSON passed from server to client.
The Builder API is intended to:
- Provide a more familiar api to javascript developers
- Provide better discoverability of SciChart features when using typescript
- Enable charts to be defined using pure data, so that they can be serialized and deserialized
It is not intended to completely replace the existing API. The two can be used in combination, and the original api is more suitable for some tasks, and required for others. Currently it only supports 2D charts.
Discovering the Builder API
To use the SciChart.js Builder API, you will need this import.
| Example Title |
Copy Code
|
|---|---|
import { chartBuilder } from "scichart";
|
|
chartBuilder exposes all the builder methods, which can be used to build parts of, or the entire chart from a JSON definition.
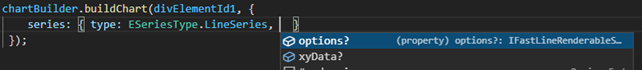
The top level method is buildChart, which takes the id of the target div, and a definition, which can be a JSON string or an object.
Note that all the elements are optional. This lets you define partial definitions that you can reuse and combine.
Worked Examples of the Builder API
We've created some worked examples of the Builder API on the following pages. Also check out our Github and SciChart demo where we have published some examples of the Builder API.
Builder API Documentation Pages
- Documentation: Creating a Simple Chart
- Documentation: Working with Data
- Documentation: Complex Customisation
- Documentation: Custom Subtypes
Builder API Examples
- Example: Simple Chart using Builder API
- Example: Full Chart using Builder API
- Example: Chart from JSON
- Example: Reusable Templates with Shared Data
- Example: Custom Subtypes with Builder API
TypeScript Intellisense
The Builder API is best when used with Typescript, so it can guide you as to what types are available or required.
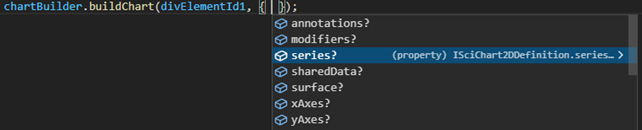
Intellisense shows which options can be passed to buildChart:
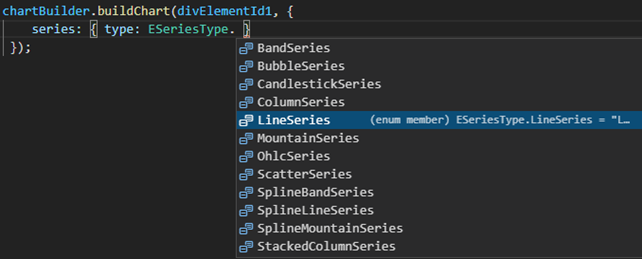
Intellisense will show you the series definition must have a type property which is an ESeriesType. This shows you all the series types that SciChart provides (more than shown in this screenshot).
Once you have selected a series, the properties and types will become specific to that series type: