
SciChart.js is a High Performance WebGL / WebAssembly chart library. Out of the box SciChart.js can achieve incredible performance vs. other JavaScript Chart Libraries on the market, capable of rendering millions of datapoints.
If you've hit performance problems in your application and want to get the best possible performance out of SciChart.js, the following is a comprehensive list of optimisations you can use in your application code in order to make our charts the fastest possible. You don't need to do all of them, our recommendation would be to apply some when needed and
1.1 Data is Sorted in X (TimeSeries Data) is Faster than Unsorted (Scatter Data)
Impact: Large Improvement to Rendering in apps on all browsers
SciChart.js uses a number of optimised algorithms when your data is sorted in the X-direction.
Algorithms such as Hit-Test (used by cursors, tooltips), indexing and drawing have a faster path when the data is sorted in X vs. unsorted.
We recommend to ensure time-series data is sorted in X for the best performance, but SciChart.js will still draw charts with big data with unsorted (scatter) data just fine!
1.2 Specify Data Distribution & Properties
Impact: Moderate Improvement to Data Manipulations in apps with frequently updating data
SciChart will automatically detect the distribution of your data & properties to choose the right algorithms for fastest and most accurate drawing. For example, properties that SciChart detects include:
- Data is Sorted in X direction
- Data contains NaN (Not a Number)
- Data spacing in X is evenly spaced
These properties allow us to choose the best & fastest algorithms for drawing, but detecting these properties takes some CPU time.
You can tell SciChart.js these properties in advance to save the time when creating dataseries, and appending and updating data.
1.3 Batch Updates to DataSeries
Impact: Large Improvement to Data Manipulations in apps with frequently updating data
SciChart DataSeries have functions like append(), insert(), update(), removeAt() where you can modify the data that the chart is showing. This allows you to achieve real-time updates in SciChart.
It is faster to update the DataSeries in batches aka using functions appendRange(), insertRange(), removeRange() where you modify an array of data than to use single-point changes.
1.4. Initialize DataSeries with Capacity
Impact: Small Improvement to Data Manipulations in apps with frequently updating data
Internally, SciChart DataSeries use a geometric resizing algorithm which reserves more memory than needed as you call append(), appendRange(). Starting with a new DataSeries and calling .append() many times may result in several resizes of the underlying vector as the DataSeries grows.
To avoid this, and reduce unnecessary allocations, if the size is known ahead of time you can initialize a DataSeries with capacity.
1.5 Use FifoCapacity (if applicable)
Impact: Small Improvement to Data Manipulations in apps with frequently updating data
When you want to discard old data beyond a certain size, or scroll or sweep the chart, using XyDataSeries.fifoCapacity can improve performance (certainly reduces memory usage).
Fifo (First-in-first-out) mode pre-allocates a circulate buffer of size N internally. When a dataSeries is declared with fifoCapacity, then data beyond that count is automatically discarded. This limits the growth of memory and provides an efficient way to scroll or sweep charts, such as in signal monitoring or ECG (medical) applications.
1.6 Float64Array vs. Array
Impact: Small Improvement to Data Manipulations in apps with frequently updating data
Before appending data into XyDataSeries.appendRange() you must buffer the data in arrays of numbers. JavaScript and TypeScript offers a built-in typed array called Float64Array. Using this type as a buffer for your data conveys minor performance improvements.
1.7 Reduce allocations by re-using buffers
Impact: Small Improvement to Data Manipulations in apps with frequently updating data
If your code requires creating lots of Arrays to buffer data before passing to xyDataSeries.appendRange(), consider re-using these buffers to avoid continuously allocating new memory.
For example:
There is a static overhead when creating multiple charts in SciChart.js. For one chart we run the drawing loop and WebGL drawing once, then copy the result to the screen. For 100 charts, we run the drawing loop 100x and copy the result to the screen 100x.
Below are some ways to improve performance signficantly when dealing with many charts on the screen.
2.1 Freeze Drawing for Charts out of view
Impact: Large Improvement to Rendering Performance in multi-chart applications where charts may be out of view in a scroll viewer or tab control
New to SciChart.js 3.5.727!
We've added a flag SciChartSurface.freezeWhenOutOfView which when set, uses the IntersectionObserver API to pause/resume rendering on charts which are outside the viewport e.g. outside of scroll view. This can yield large performacne gains when rendering many charts.
This can be used to achieve very large performance boosts by setting the flag, which can be set as a property on SciChartSurface, or via the constructor options e.g. SciChartSurface.create(divElementId, { freezeWhenOutOfView: true });
2.2. Grouping charts with SubCharts to share WebGL Drawing
Impact: Large Improvement to Rendering Performance in multi-chart applications where many chart panes are on screen, especially in some browsers (Mozilla, Safari)
The Sub-Charts API is a way to group charts into a single parent SciChartSurface. Using this API you can achieve the best of both worlds: having multiple chart panes and fewer drawing loop calls and fewer WebGL calls.
We've created a set of tutorials on how to create multi-pane and re-usable chart groups using the SubCharts API. You can find these below:
- Re-usable Chart Groups with Sub-Charts
- Dynamic Multi-Panel Charts with SubCharts
- Resizable Multi-Pane Charts with SubCharts
- Using SubCharts to create a Large Dashboard with 100 Charts
2.3 Reduce Axis Elements & Label Count
Impact: Moderate Improvement to Rendering Performance in multi-chart applications on all browsers
In a multi-chart scenario, axis elements and labels contribute a significant portion of the draw time. This is whether you use SubCharts or not.
Simply reducing axis elements (e.g. reducing the frequency of tick labels, gridlines), or turning off minor gridlines, major/minor ticks can signicantly improve the performance in cases where there are many charts (e.g 10 charts or more) on screen.
2.4 Use One WebGL Context per SciChartSurface
Impact: Moderate Improvement to Rendering Performance on some browsers e.g. Mozilla at the expense of slower chart startup time & higher memory use
The function SciChartSurface.create() uses a single shared WebGL Rendering engine and one shared WebGL context for all chart surfaces. This allows us to have multiple charts (up to hundreds of charts) in a single webpage. It results in lower memory usage and faster initialization (chart start-up time) in a multi-chart scenario.
The function SciChartSurface.createSingle() creates one WebGL Context per SciChartSurface. This gives faster drawing performance but will quickly hit the limit of WebGL contexts in a webpage. It also requires one instance of the WebGL Rendering engine per chart, so will have higher static startup time and memory usage.
Approximate WebGL Context Limits per browser can be found below.
| Browser | Max WebGL Contexts per Page |
| Firefox (Windows, macOS) | 300 |
| Chrome (Windows, macOS) |
16 |
| Edge (Windows) | 16 |
| Safari (macOS) | 16 |
| Safari (iOS) | 16 |
| Chrome (Android) | 8 |
3.1 Native Text Labels
Impact: Large Improvement to Rendering Performance in multi-chart applications which have a lot of text labels
By default, SciChart draws axis labels and chart titles using HTML5 labels. This allows more flexibility of choosing fonts but also introduces a performance hit. This is particularly noticeable when there are many charts on the screen (as many charts = many labels).
An alternative is to enable Native Text, where fast WebGL hardware accelerated labels are drawn. This will have a large performance benefit in multi-chart dashboards.
Using native text gives significant performance benefits if you have multiple charts with lots of axis labels, or when you have multiple charts with chart titles.
Read the blog post Creating a React Drag & Drop Chart Dashboard Performance Demo with 100 Charts which shows the impact of the Native Text API where 100 charts are hosted inside a scroll view.
3.2 Shared Label Cache
Impact: Moderate Improvement to Rendering Performance in multi-chart applications which have a lot of text labels
Previously labels were cached per axis, but it is now possible to reuse cached labels across axes and across charts. This improves label drawing performance in multi-chart scenarios.
You can enable this globally by setting:
Or you can enable it for a particular axis by setting useSharedCache to true on the axis options, or directly on the SciChartDefaults type.
This will give significant benefit if you have multiple charts with very similar sets of labels, even if they are not on screen at the same time. Labels are retained in the cache for a minute, so switching to a different chart that has some or all of the same labels will reuse the labels, saving a few hundred ms.
Using shared label cache gives significant performance benefits if you have multiple charts with very similar sets of labels, even if they are not on screen at the same time.
Read the blog post Creating a React Drag & Drop Chart Dashboard Performance Demo with 100 Charts which shows the impact of the the label cache where 100 charts are hosted inside a scroll view.
3.3 Async Labels
Async labels was available in earlier versions of ScIChart.js, but has been deprecated in favour of Native text labels.
4.1 Use the Fastest Browser!
Impact: Moderate Improvement to Rendering Performance
By far, the fastest browser for WebGL, WebAssembly and JavaScript is Google Chrome.
Browsers such as Safari, Firefox have slower execution of JavaScript code. Please bear this in mind when comparing performance or when making recommendations to your customers!
4.2 Retina macOS Performance
Impact: Moderate Improvement to Rendering Performance on Retina Mac browsers
When SciChart.js is used on a high resolution display such as Retina, the chart will be rendered at 4x the number of pixels visible on screen. For example a 1,000 x 1,000 chart (1M Pixels) will be rendered at 2,000 x 2,000 (4M Pixels) before scaling down to the correct size.
Higher number of pixels means more work for the browser to display the chart. If you notice any performance degredation on your application you can disable Dpi scaling using the code below.
Also, we recommend use of Google Chrome browser as this has by far the best performance metrics, compared to Safari or Firefox, which both struggle to render large canvases.
4.3 Dual GPU machines or Macbook Pro
Impact: Moderate Improvement to Rendering Performance on Dual GPU machines
Some Windows PCs and many macOS computers such as Macbook Pro have dual GPUs. A slower integrated GPU which uses less battery power, and a faster dedicated GPU which has better rendering performance.
When using a browser (Safari or Chrome) on macOS, the operating system by default picks the slower, integrated GPU. Here's how you can check and force the dedicated GPU.
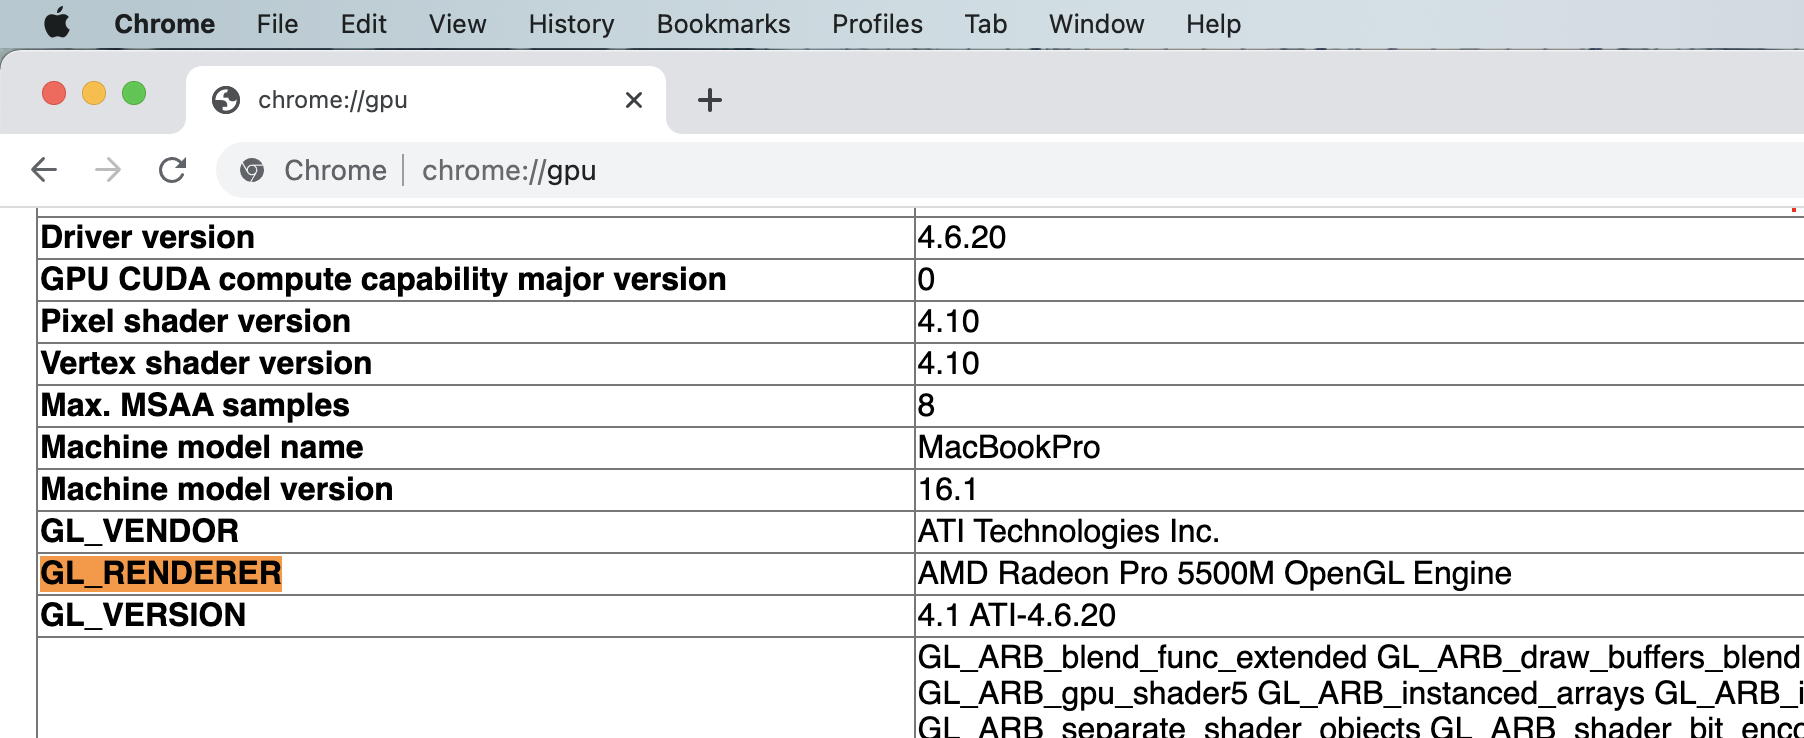
4.3.1 Checking which GPU you are using on macOS or Windows
In Chrome on macOS you can navigate to chrome://gpu in the address bar to inspect which GPU the browser is currently using.
Scroll down to GL_RENDERER. On the right you can see the current GPU e.g. 'AMD Radeon Pro 5500M' or 'Intel UHD 630'
4.3.2 Forcing the Faster GPU on macOS
If you are using the integrated GPU and want to force the faster GPU on macOS, you can use an application called gfxCardStatus to force switching to the faster and more powerful GPU. Restart your browser and do the test again. This will improve WebGL performance!
There are applications which will allow you to switch GPU on Windows as well. Make sure you restart your browser and do the GL_RENDERER test again.
We are always working on improving performance of the overall charting engine.
Staying up to date helps to ensure you have the latest algorithms and optimisations for fast, efficient charting with SciChart.js.
Still Need Help?
If after all that, do you still need help?
If you have a performance question about SciChart.js or need further improvements and you are a paid (licensed) customer, then contact-us and our team will do their best to help!