SciChart.js JavaScript 2D Charts API > Animations API > Series Startup Animations
Series Startup Animations

There are several series startup Animation Types provided out of the box in SciChart.js. These are:

  • FadeAnimation
  • ScaleAnimation
  • SweepAnimation
  • WaveAnimation

Sweep Startup Animation

Let's see a simple example of using Sweep Animation on chart types in SciChart.js
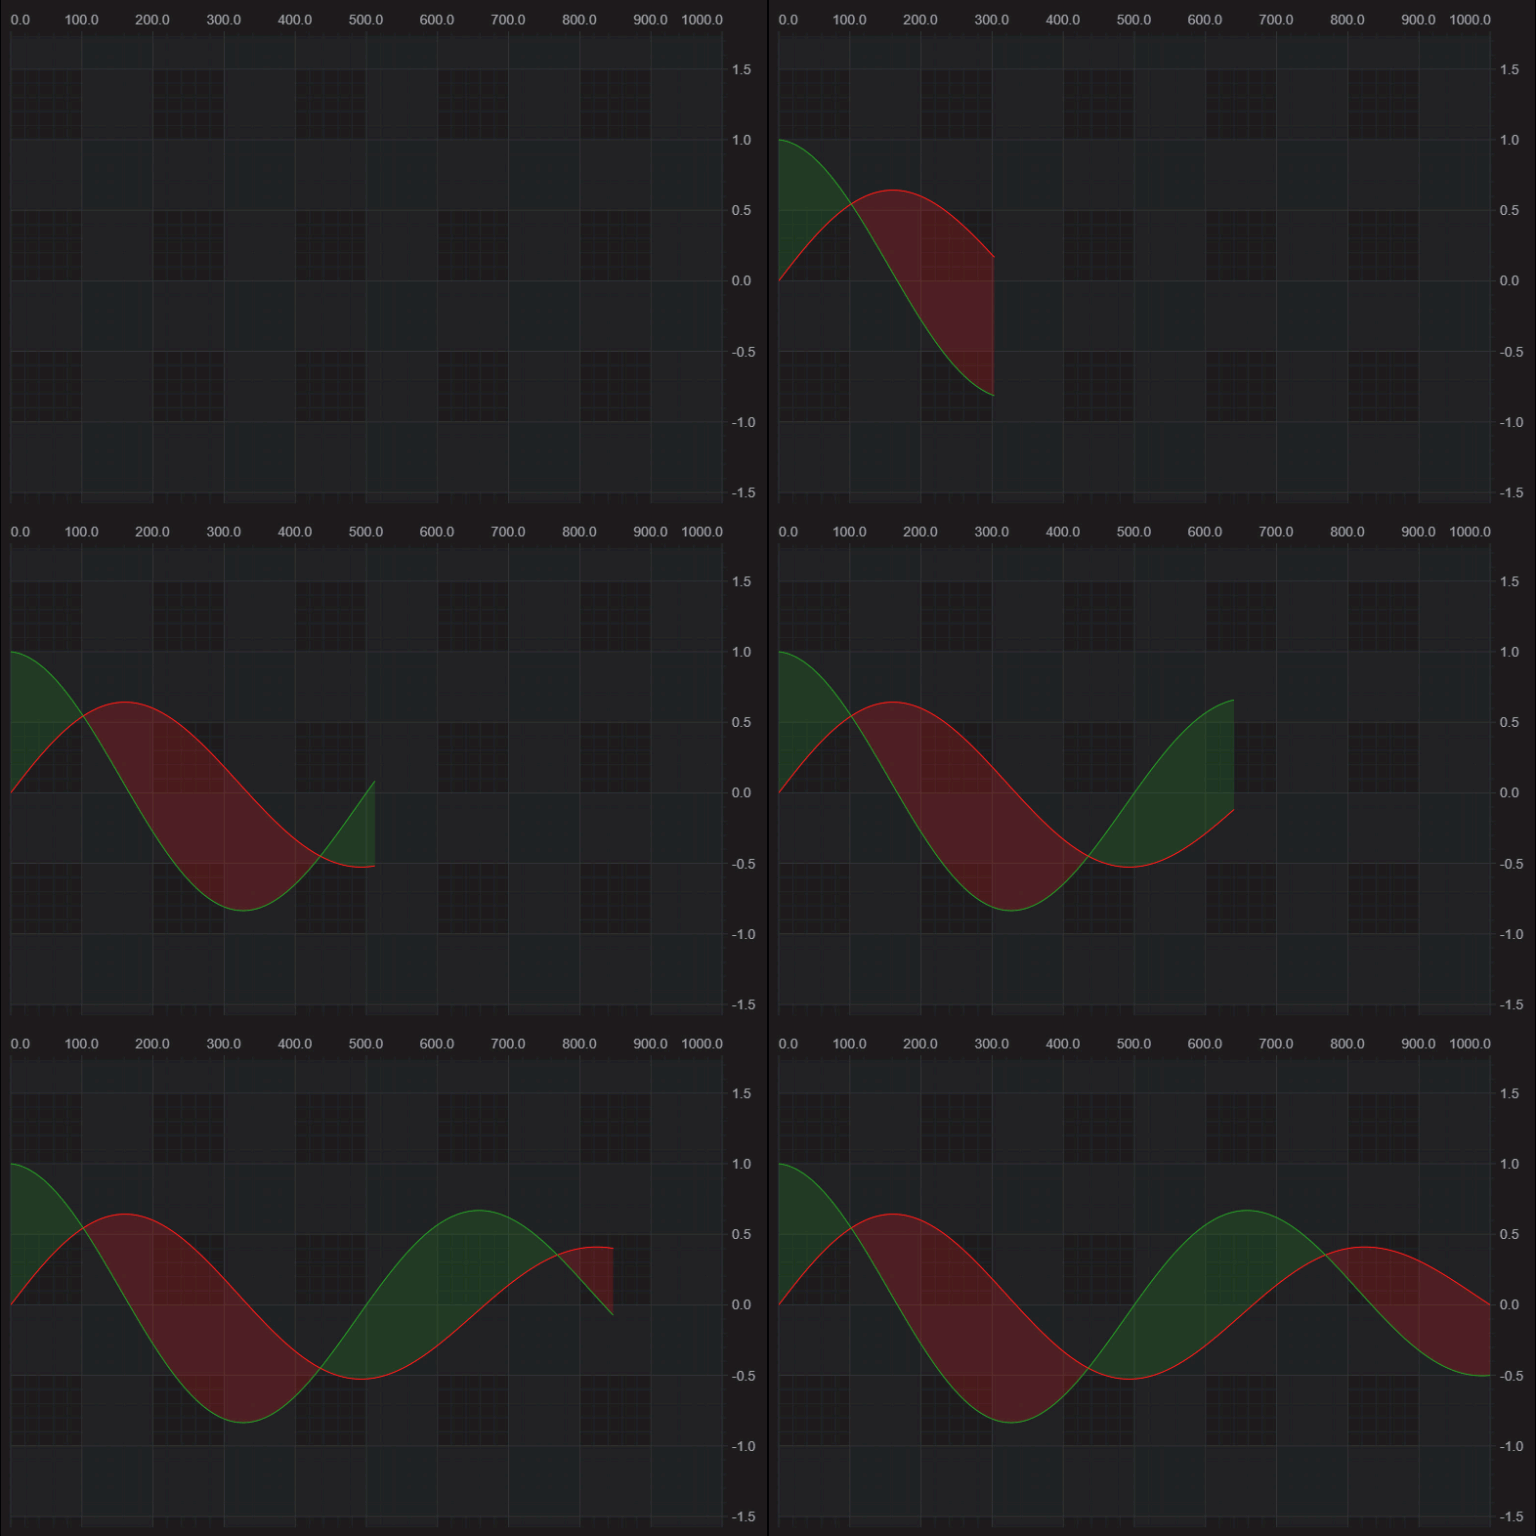
const rendSeries = new FastBandRenderableSeries(wasmContext, {
    dataSeries,
    strokeThickness: 2,
    animation: new SweepAnimation({ duration: 1000 }),
});

// Alternatively
rendSeries.enqueueAnimation(new SweepAnimation({ duration: 1000 }));

Fade Startup Animation

Now let's see an example of using Fade Animation on some chart types in SciChart.js
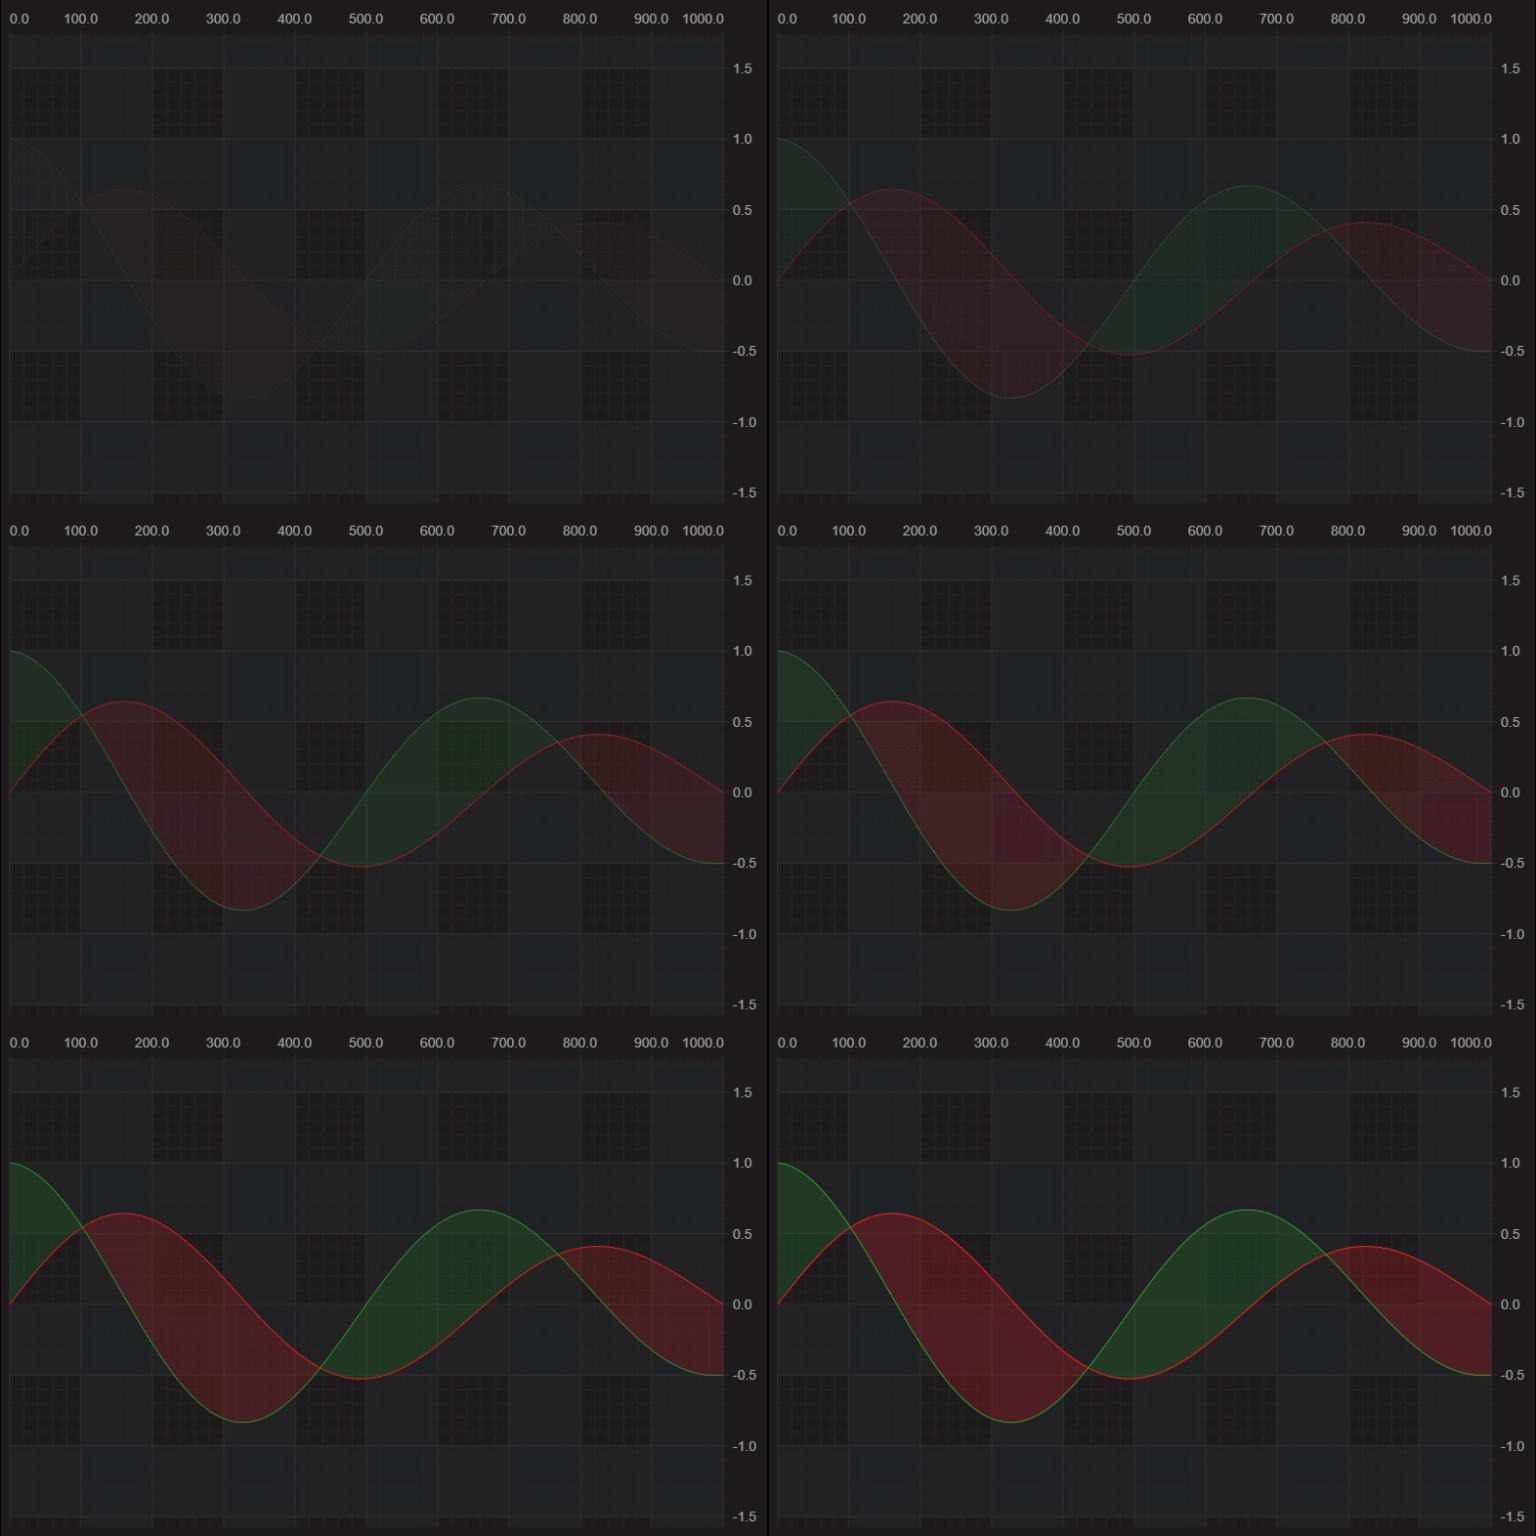
const rendSeries = new FastBandRenderableSeries(wasmContext, {
    dataSeries,
    strokeThickness: 2,
    animation: new FadeAnimation({ duration: 1000 }),
});

// Alternatively
rendSeries.enqueueAnimation(new FadeAnimation({ duration: 1000 }));

Note: The Sweep, Scale and Wave animations also support fade/opacity by setting the Animation.fadeEffect property to true.

Scale Startup Animation

Now let's see an example of the Sweep animation on chart types in SciChart.js.
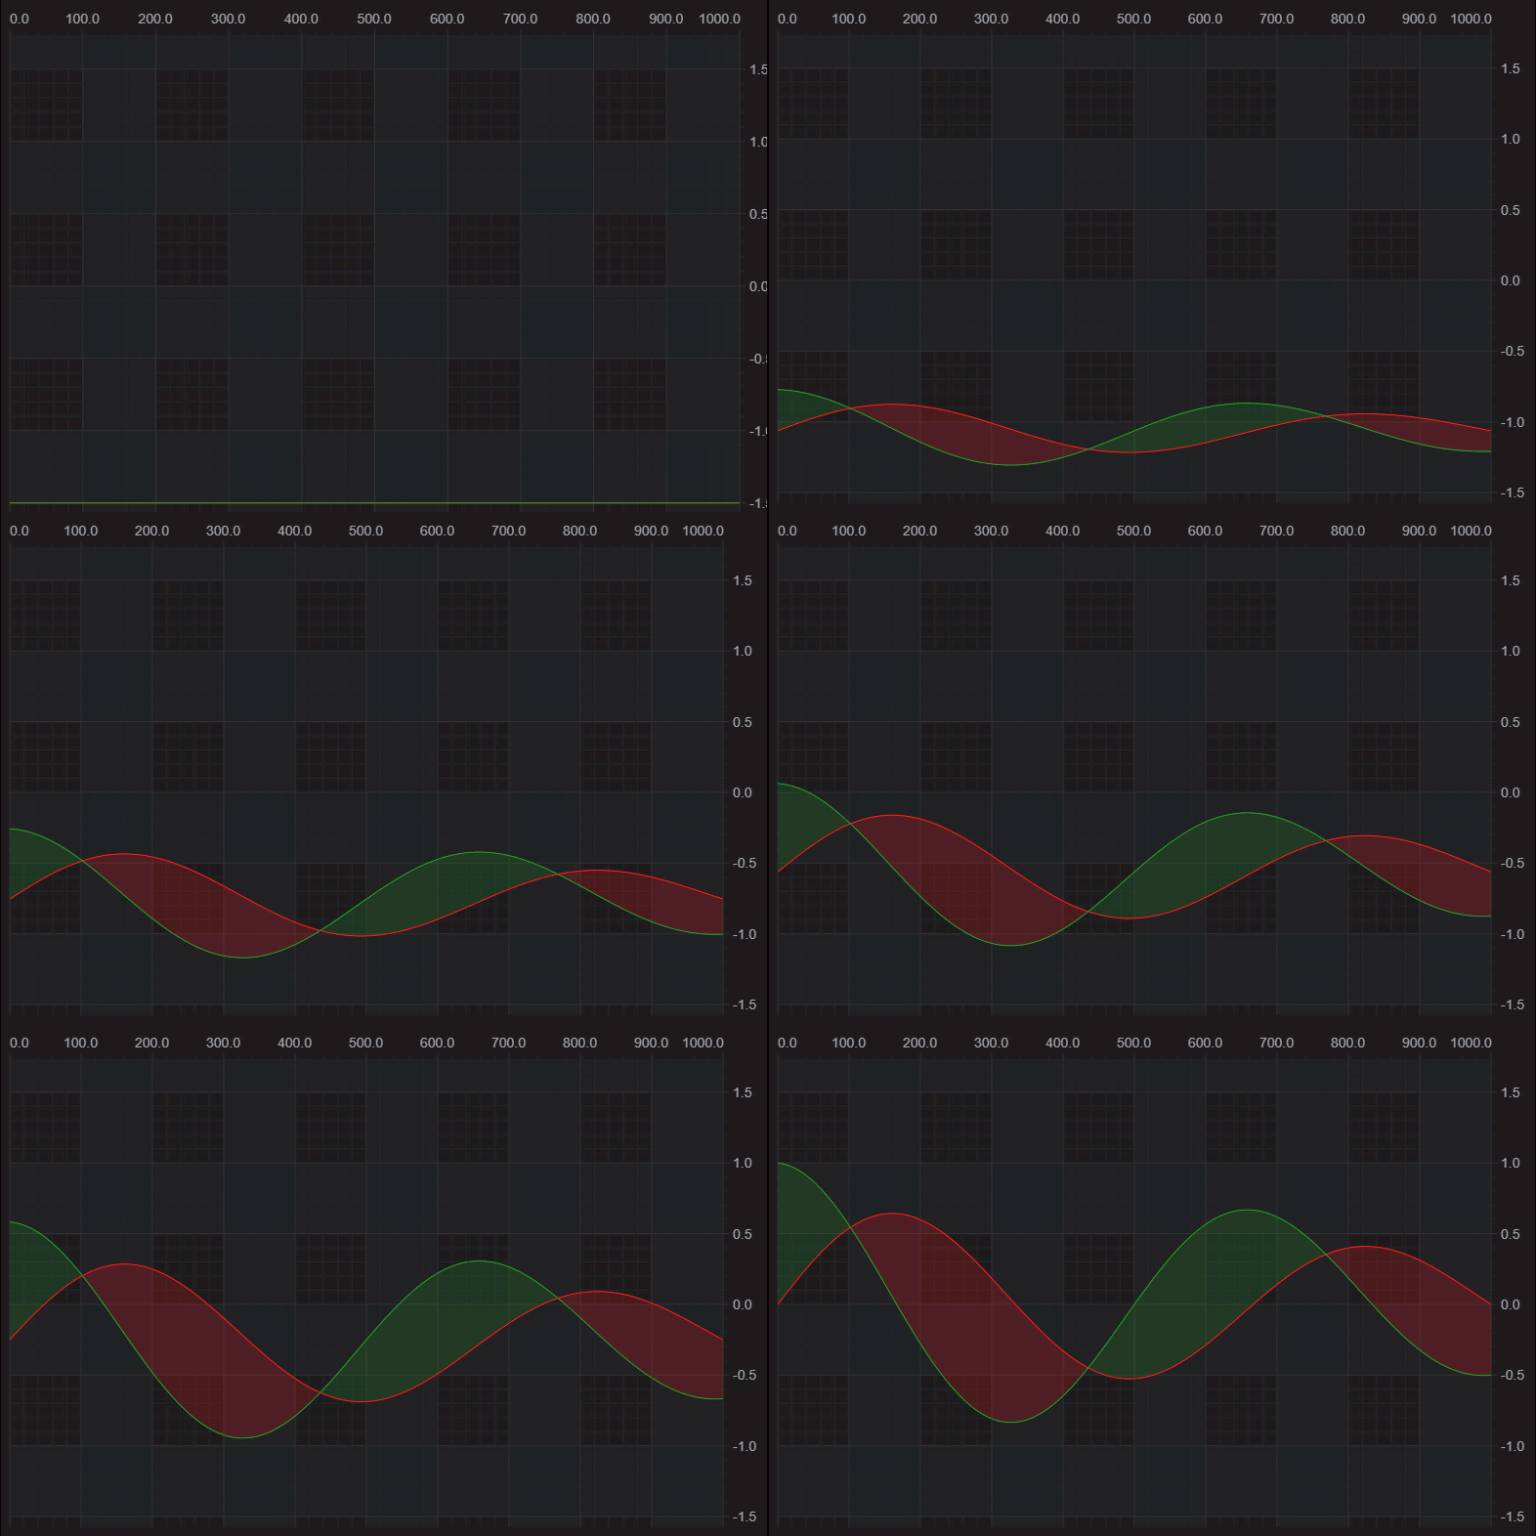
const rendSeries = new FastBandRenderableSeries(wasmContext, {
    dataSeries,
    strokeThickness: 2,
    animation: new ScaleAnimation({ duration: 1000, zeroLineY: -1.5 }),
});

// Alternatively
rendSeries.enqueueAnimation(new ScaleAnimation({ duration: 1000 }));

Wave Startup Animation

Finally let's see an example of the Wave animation on chart types in SciChart.js.
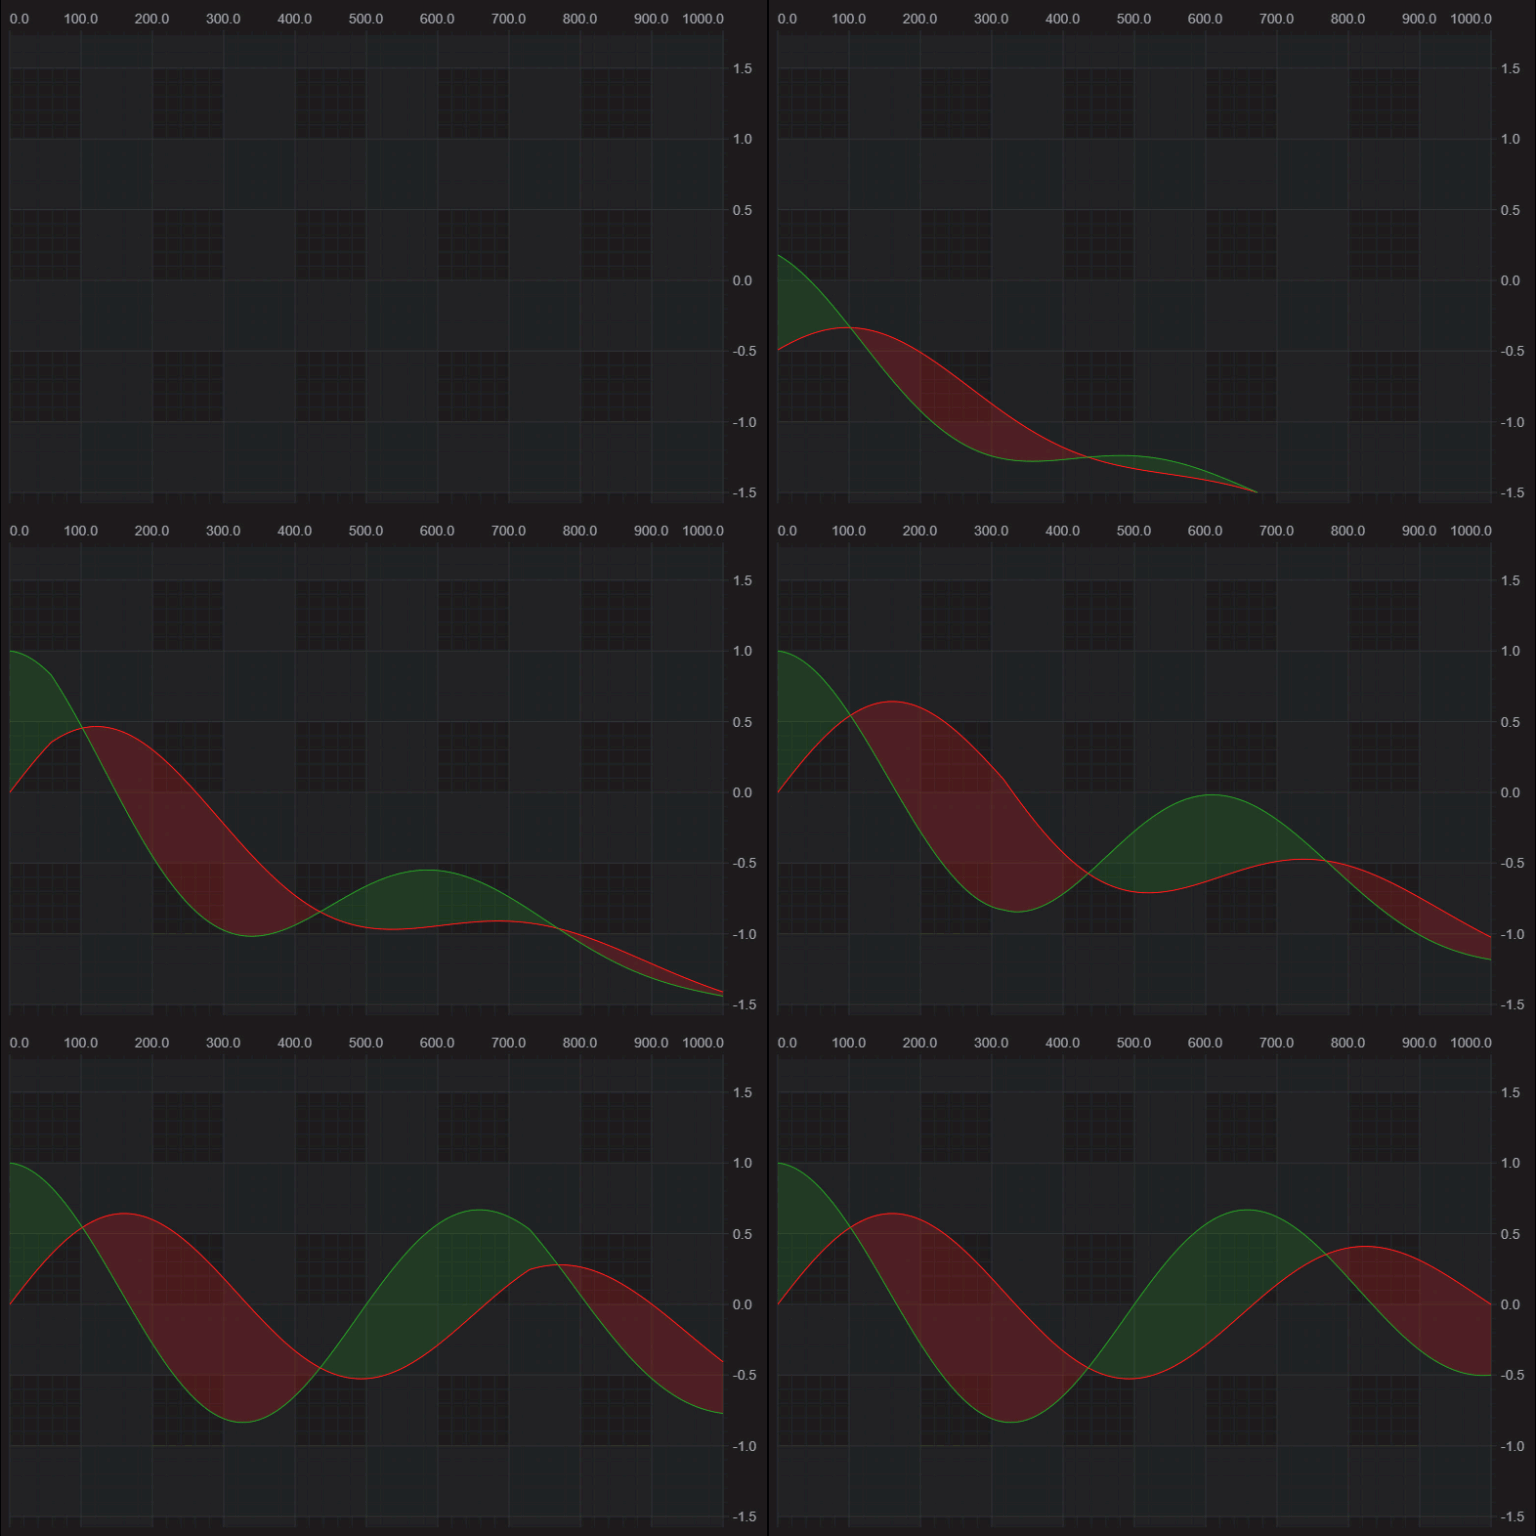
const rendSeries = new FastBandRenderableSeries(wasmContext, {
    dataSeries,
    strokeThickness: 2,
    animation: new WaveAnimation({ duration: 1000, pointDurationFactor: 0.5, zeroLineY: -1.5 }),
});

// Alternatively
rendSeries.enqueueAnimation(new WaveAnimation({ duration: 1000 }));


See Also