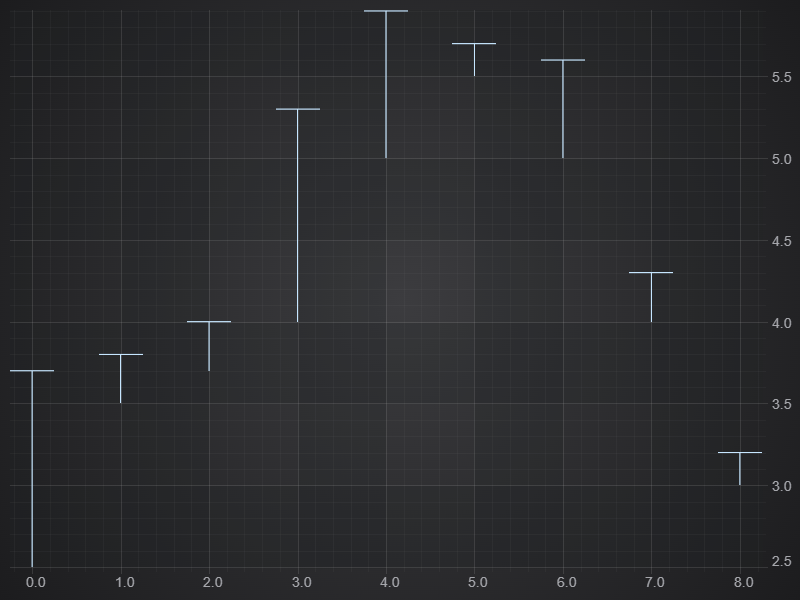
Error Bars can be added to a SciChart.js chart using the FastErrorBarsRenderableSeries type.
The JavaScript Error Bars Chart Example can be found in the SciChart.Js Examples Suite on Github, or our live demo at demo.scichart.com
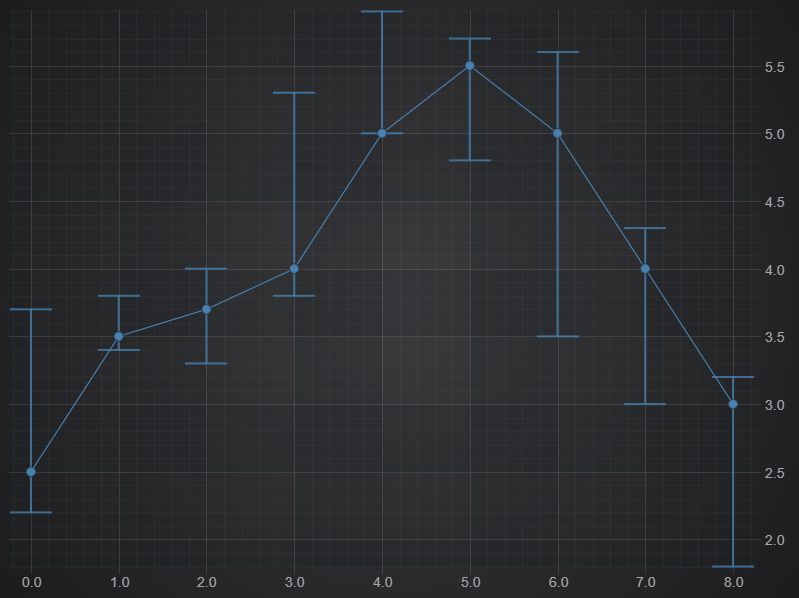
Above: The JavaScript Error Bars Chart example from the SciChart.js Demo.
Creating Error Bars Series
To create a Javascript Error Bars Chart with SciChart.js, use the following code:
In the code above:
- We define HlcDataSeries, passing arrays with X, Y, High, and Low values
- A FastErrorBarsRenderableSeries is created with dataSeries option and added to the SciChartSurface.renderableSeries collection.
- Alternatively we can assign a FastErrorBarsRenderableSeries.dataSeries property, which stores the HLC data to render.
This results in the following output:
<div id="scichart-root" ></div>
body { margin: 0; }
#scichart-root { width: 100%; height: 100vh; }
async function simpleErrorBarsChart(divElementId) {
// #region ExampleA
// Demonstrates how to create a chart with error bars using SciChart.js
const {
  SciChartSurface,
  NumericAxis,
  FastErrorBarsRenderableSeries ,
  HlcDataSeries,
  EErrorMode,
  EErrorDirection,
  EDataPointWidthMode,
  SciChartJsNavyTheme
} = SciChart;

// or, for npm, import { SciChartSurface, ... } from "scichart"

const { wasmContext, sciChartSurface } = await SciChartSurface.create(divElementId, {
  theme: new SciChartJsNavyTheme()
});
sciChartSurface.xAxes.add(new NumericAxis(wasmContext));
sciChartSurface.yAxes.add(new NumericAxis(wasmContext));

const xValues = [0, 1, 2, 3, 4, 5, 6, 7, 8];
const yValues = [2.5, 3.5, 3.7, 4.0, 5.0, 5.5, 5.0, 4.0, 3.0];
const highValues = [3.7, 3.8, 4.0, 5.3, 5.9, 5.7, 5.0, 4.3, 3.2];
const lowValues = [2.2, 3.4, 3.3, 3.8, 5.0, 4.8, 3.5, 3.0, 1.8];

const dataSeries = new HlcDataSeries(wasmContext, {
  xValues,
  yValues,
  highValues,
  lowValues
});

const errorBarsSeries = new FastErrorBarsRenderableSeries(wasmContext, {
  dataSeries,
  stroke: "#50C7E0",
  strokeThickness: 2,
  // Optional parameters. Defaults are Both, Vertical
  errorMode: EErrorMode.Both,
  errorDirection: EErrorDirection.Vertical,
  // More optional parameters. Defaults are 0.5, Relative
  dataPointWidth: 0.5,
  dataPointWidthMode: EDataPointWidthMode.Relative
});

sciChartSurface.renderableSeries.add(errorBarsSeries);
// #endregion
// Optional: add zooming, panning for the example
const { MouseWheelZoomModifier, ZoomPanModifier, ZoomExtentsModifier } = SciChart;
sciChartSurface.chartModifiers.add(new MouseWheelZoomModifier(), new ZoomPanModifier, new ZoomExtentsModifier());
};
simpleErrorBarsChart("scichart-root");
async function builderExample(divElementId) {
// #region ExampleB
// Demonstrates how to create a chart with error bars in SciChart.js using the Builder API
const {
  chartBuilder,
  ESeriesType,
  EThemeProviderType
} = SciChart;

// or, for npm, import { chartBuilder, ... } from "scichart"

const { wasmContext, sciChartSurface } = await chartBuilder.build2DChart(divElementId, {
  surface: { theme: { type: EThemeProviderType.Dark } },
  series: [
    {
      type: ESeriesType.ErrorBarsSeries,
      hlcData: {
        xValues: [0, 1, 2, 3, 4, 5, 6, 7, 8],
        yValues: [2.5, 3.5, 3.7, 4.0, 5.0, 5.5, 5.0, 4.0, 3.0],
        highValues: [3.7, 3.8, 4.0, 5.3, 5.9, 5.7, 5.0, 4.3, 3.2],
        lowValues: [2.2, 3.4, 3.3, 3.8, 5.0, 4.8, 3.5, 3.0, 1.8]
      },
      options: {
        stroke: "#50C7E0",
        strokeThickness: 3,
      }
    }
  ]
});
// #endregion
};
// Uncomment this to use the builder example
//builderExample("scichart-root");
Error Mode
FastErrorBarsRenderableSeries.errorMode property defines whether high and low caps should be displayed on error bars. Available values are defined by enum EErrorMode. We can set this property either via the series itself, or passing in to constructor options (see type IFastErrorBarsRenderableSeriesOptions).
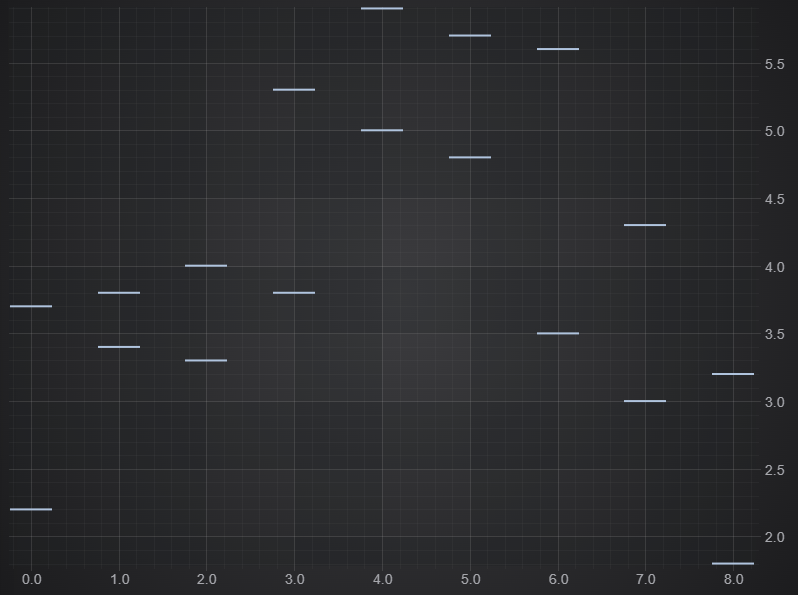
The following example shows how to use only high error on bars.
| High error bars only |
Copy Code
|
|---|---|
const errorBarsSeries = new FastErrorBarsRenderableSeries(wasmContext, {
    dataSeries: hlcDataSeries,
    errorMode: EErrorMode.High,
});
|
|
This results in the following output:
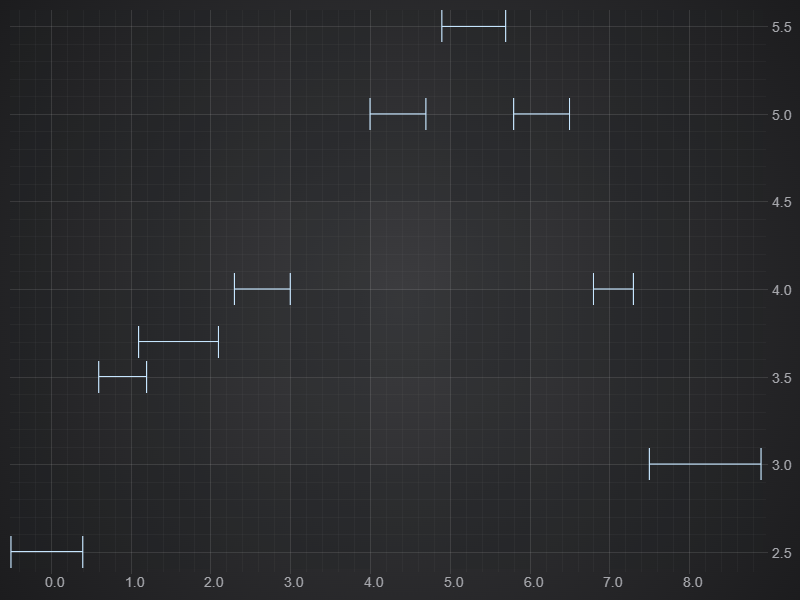
Horizontal Error Bars
It is possible to change the direction of Error Bars to horizontal using FastErrorBarsRenderableSeries.errorDirection property. In this case the High & Low values in HlcDataSeries are applied in the X-direction.
| Horizontal Error Bars |
Copy Code
|
|---|---|
import { EErrorDirection } from "scichart";
// ...
const xValues = [0, 1, 2, 2.5, 4.5, 5, 6, 7, 8];
const yValues = [2.5, 3.5, 3.7, 4.0, 5.0, 5.5, 5.0, 4.0, 3.0];
const lowValues = [-0.5, 0.6, 1.1, 2.3, 4.0, 4.9, 5.8, 6.8, 7.5];
const highValues = [0.4, 1.2, 2.1, 3.0, 4.7, 5.7, 6.5, 7.3, 8.9];
const hlcDataSeries = new HlcDataSeries(wasmContext, {
    xValues,
    yValues,
    // High, Low becomes left-right as absolute values
    highValues,
    lowValues
});
const errorBarsSeries = new FastErrorBarsRenderableSeries(wasmContext, {
    dataSeries: hlcDataSeries,
    errorDirection: EErrorDirection.Horizontal,
});
// ...
|
|
This results in the following output:
Error Bars Advanced Properties
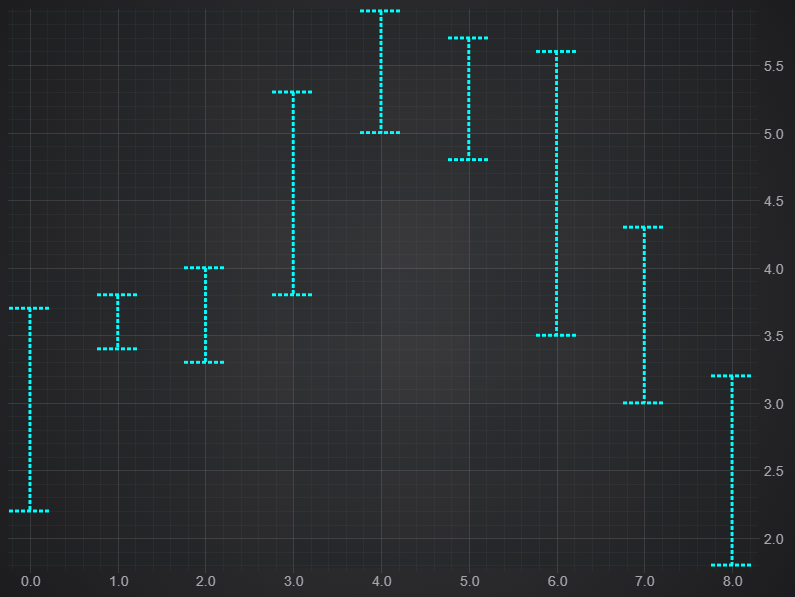
Setting Stroke, StrokeThickness and StrokeDash
Error Bars in SciChart.js support setting stroke, strokeThickness and strokeDashArray to set a dashed line style.
For example, this code:
| Error Bars Line Styles |
Copy Code
|
|---|---|
const errorBarsSeries = new FastErrorBarsRenderableSeries(wasmContext, { dataSeries: hlcDataSeries, stroke: "Aqua", strokeDashArray: [4, 2], strokeThickness: 4, }); |
|
Results in this:
Drawing a Line and PointMarker through Error Bars
You can add a PointMarker to highlight the Y-value of an HlcDataSeries. The data can also be used twice to display both lines / scatter points and error bars.
Try this code out:
| Lines and ErrorBars |
Copy Code
|
|---|---|
import { FastLineRenderableSeries, FastErrorBarsRenderableSeries, HlcDataSeries, EllipsePointMarker  } from "scichart";

// Many RenderableSeries can share one DataSeries in SciChart
// Use the HlcDataSeries on a FastLineRenderableSeries, it will render XY value
const lineSeries = new FastLineRenderableSeries(wasmContext, { dataSeries: hlcDataSeries, stroke: "SteelBlue" });

// Use the same HlcDataSeries on a FastErrorBarsRenderableSeries. It will render high/lows for error bars
const errorBarsSeries = new FastErrorBarsRenderableSeries(wasmContext, {
    dataSeries: hlcDataSeries,
    stroke: "SteelBlue",
    strokeThickness: 3,
    opacity: 0.77,
    pointMarker: new EllipsePointMarker(wasmContext, {
        width: 10,
        height: 10,
        fill: "SteelBlue",
        stroke: "#333"
    })
});

sciChartSurface.renderableSeries.add(lineSeries);
sciChartSurface.renderableSeries.add(errorBarsSeries);
|
|
This results in the folllowing output:
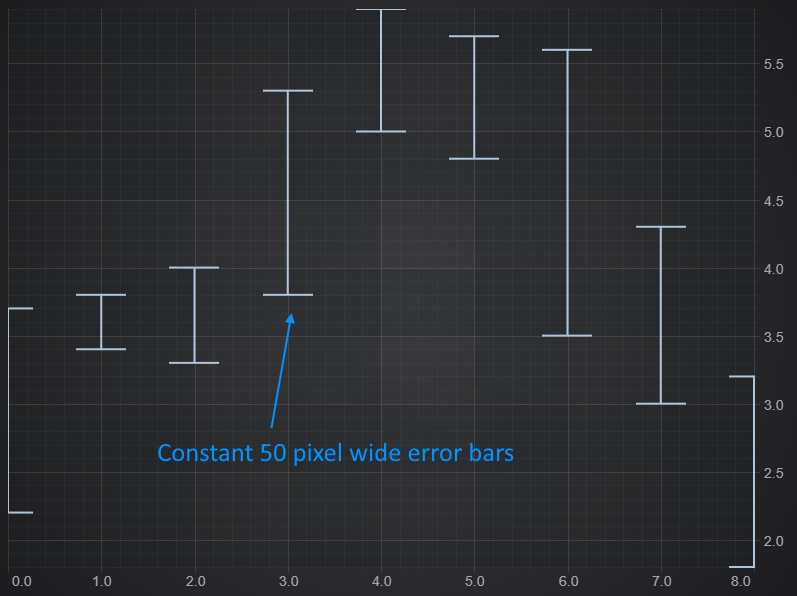
Setting the Width of Error Bars Whiskers
You can define the width of Error Bars using dataPointWidth and dataPointWidthMode which supports values from EDataPointMode.
For example. setting dataPointWidthMode to Absolute and dataPointWidth to 50 ensures 50 pixels always.
| dataPointWidth on ErrorBars |
Copy Code
|
|---|---|
const errorBarsSeries = new FastErrorBarsRenderableSeries(wasmContext, { dataSeries: hlcDataSeries, stroke: "LightSteelBlue", strokeThickness: 3, dataPointWidth: 50, dataPointWidthMode: EDataPointWidthMode.Absolute, }); sciChartSurface.renderableSeries.add(errorBarsSeries); |
|
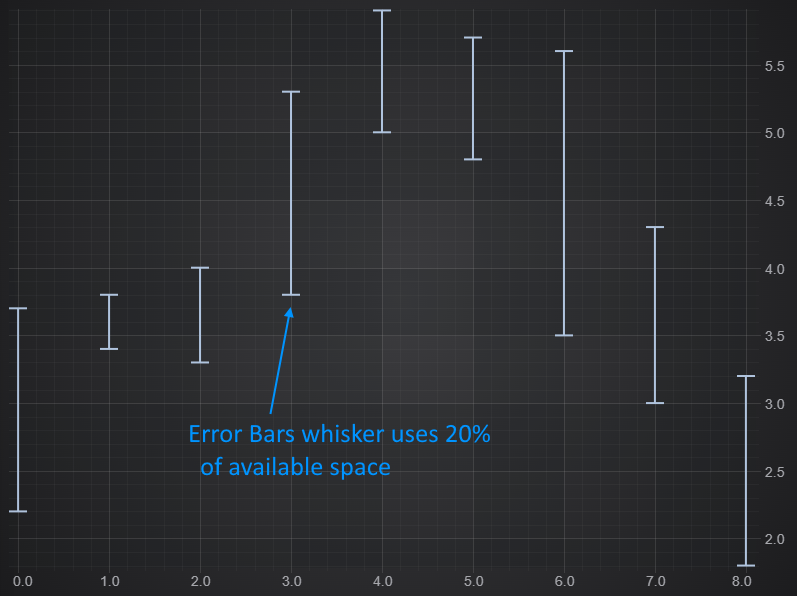
The alternative mode is EDataPointWidthMode.Relative. In this mode a dataPointWidth value of 0.0 - 1.0 occupies 0% to 100% of the available space as calculated by SciChart.js.
| dataPointWidth on ErrorBars (2) |
Copy Code
|
|---|---|
const errorBarsSeries = new FastErrorBarsRenderableSeries(wasmContext, { dataSeries: hlcDataSeries, stroke: "LightSteelBlue", strokeThickness: 3, dataPointWidth: 0.2, dataPointWidthMode: EDataPointWidthMode.Relative, }); sciChartSurface.renderableSeries.add(errorBarsSeries); |
|
Showing/Hiding Error Bars Connector or Whiskers
You can specify which parts of an Error Bar should be visible using drawConnector and drawWhiskers and finally;
| hiding ErrorBar Parts |
Copy Code
|
|---|---|
const errorBarsSeries = new FastErrorBarsRenderableSeries(wasmContext, { dataSeries: hlcDataSeries, stroke: "LightSteelBlue", strokeThickness: 3, drawConnector: false, // Draw the horizontal connector drawWhiskers: true, // Draw the top/bottom whiskers }); sciChartSurface.renderableSeries.add(errorBarsSeries); |
|
Results in this: