Axis APIs - Convert Pixel to Data Coordinates
SciChart.js provides a clean and simple API to transform pixels to data-values and vice versa via the CoordinateCalculator API.
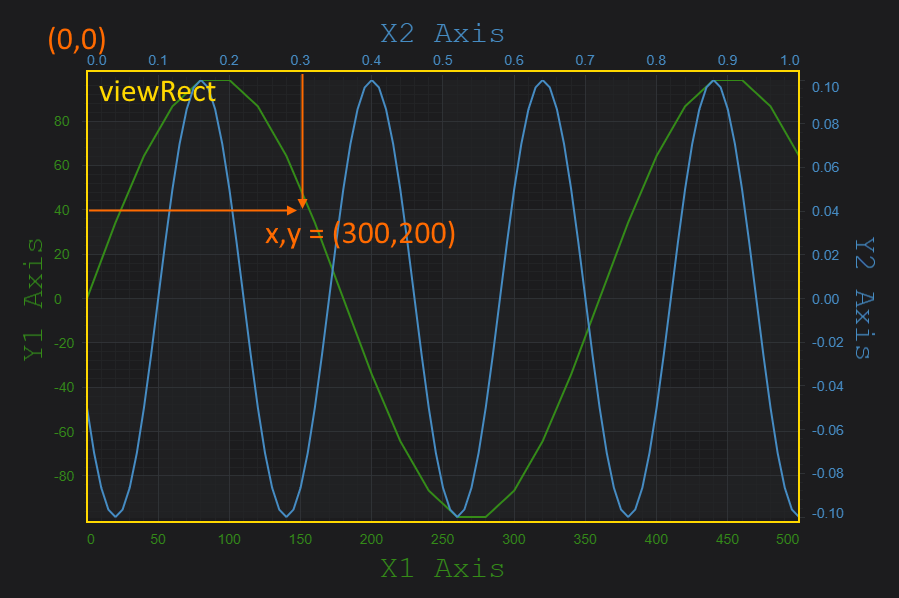
Where Pixel Coordinates are measured from
It is important to note when converting Pixels to Data Coordinates and vice versa that pixels are measured from the top-left inside corner of the series area of the chart known as the viewRect📘. So, the pixel coordinate (0,0) corresponds to the data-value at [xAxis.visibleRange.min, yAxis.visibleRange.max] and the pixel coordinate (Width, Height) corresponds to the data-value at [xAxis.visibleRange.max, yAxis.visibleRange.min].
Learn about Axis.VisibleRange and how to get/set this property at the page: Axis Ranging - Setting and Getting VisibleRange
Converting between Pixels and Data Coordinates
To convert between pixel and data coordinates, you must first get a CoordinateCalculator📘 instance. This is retrieved with the following code.
- Getting a CoordinateCalculator
const xAxis = sciChartSurface.xAxes.get(0); // Type AxisBase2D
const coordCalc = xAxis.getCurrentCoordinateCalculator(); // Type CoordinateCalculatorBase
Data-values are converted to pixel coordinates via the coordinateCalculator.getCoordinate()📘 method. Also, Coordinates in pixels are converted back to chart data-values via the coordinateCalculator.getDataValue()📘 method. It expects a coordinate in pixels and returns the closest data value to that coordinate.
All coordinates are relative to the viewRect📘 - the area where series are drawn inside the axis on the SciChartSurface.
You can find some examples how to do the conversions below.
Converting NumericAxis Data to Pixels
The NumericAxis📘 is a Value-Axis which uses data-values for measurement. It can be used to display numbers, or dates (stored as unix time stamps) formatted as date/time using the LabelProvider feature.
To convert between pixel-coordinates relative to viewRect and data-values on a NumericAxis, use the following code.
- TS
const xAxis = sciChartSurface.xAxes.get(0); // Type AxisBase2D
const coordCalc = xAxis.getCurrentCoordinateCalculator(); // Type CoordinateCalculatorBase
// Gets the pixel coordinate relative to viewRect for data-value 1.23 on this axis only
const coord = coordCalc.getCoordinate(1.23);

// Converts a pixel coordinate back to dataValue
const dataValue= coordCalc.getDataValue(coord);

// dataValue should === 1.23
Converting CategoryAxis Data to/from Pixels
CategoryAxis📘 are treated slightly differently. This axis type can also be used to display numbers, or dates (stored as unix time stamps) but we must perform an extra step to convert between data-value, index and pixel coordinate.
A Category Axis uses the index to data not the data-value itself for measurement. Learn more about Category Axis at the page Category Axis in SciChart.js
- Category Coordinate conversion
import { CategoryCoordinateCalculator, CategoryAxis } from "scichart";

const xAxis = new CategoryAxis(wasmContext);
// Get the CoordinateCalculator
const coordCalc = xAxis.getCurrentCoordinateCalculator();
// OR TypeScript only, cast as CategoryCoordinateCalculator
const coordCalc = xAxis.getCurrentCoordinateCalculator() as CategoryCoordinateCalculator;
// Get the pixel coordinate at index=10
const coord = coordCalc.getCoordinate(10);
// Convert a coordinate back to index
const index = coordCalc.getDataValue(coord);
// Convert an index to data-value
const dataValue = coordCalc.transformIndexToData(index);
Transforming Pixels to the ViewRect
Functions exist to translate a point from the parent canvas of the chart to the viewRect. This is useful if you want to transform a mouse-coordinate on the parent canvas into a data-value on the chart. For more info about his, se the Hit-Test API section.
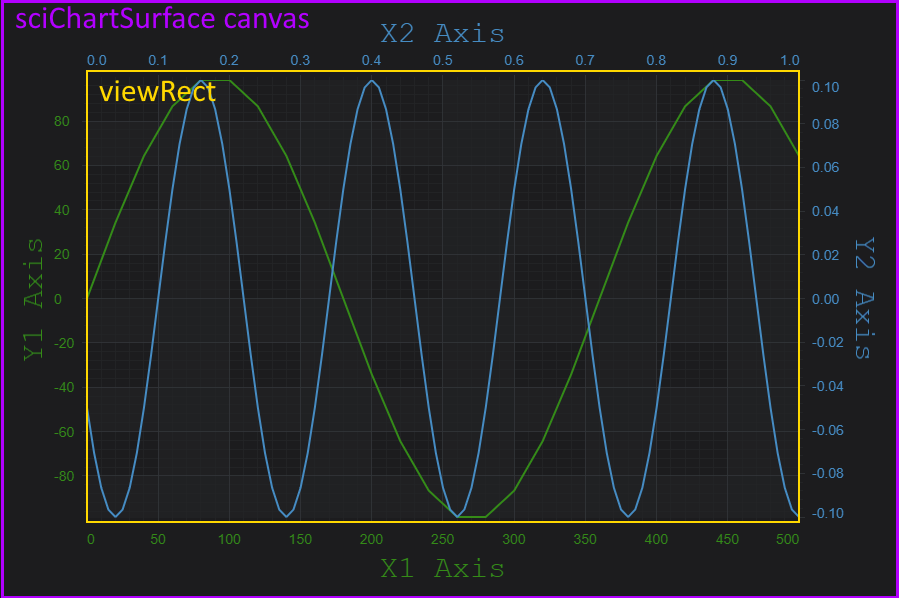
Above: The SciChartSurface sits on a canvas in the DOM. The viewRect is the inner area which draws the series.
To transform a point on the parent SciChartSurface to the viewRect, use the following code:
- Transforming Points from viewRect
import { Point } from "../../Core/Point";
import { Rect } from "../../types/Rect";
import { translateFromCanvasToSeriesViewRect } from "../../utils/translate";

const sciChartSurface; // Assuming a SciChartSurface instance
const point = new Point(100, 200);
const viewRectPoint = translateFromCanvasToSeriesViewRect(point, sciChartSurface.seriesViewRect);