Legend Modifier
SciChart.js features a rich, customisable legend API which is based on our powerful ChartModifier API. To add a Legend to a chart use LegendModifier.
SciChart legends support the following:
- Placement of the Legend inside the chart top-left, top-right, bottom-left or bottom-right aligned
- Horizontal or Vertical orientation of the Legend
- Showing data series name, line color/marker, visibility checkboxes
- Allowing full customization of the Legend using auto-generated classes scichart__legend, scichart__legend-item
- Placing the Legend anywhere outside the chart
Showing a Legend
In order to show a legend add the LegendModifier to the chart.
sciChartSurface.chartModifiers.add(new LegendModifier());
The full example code you will find below.
- TypeScript
- JavaScript
import {
    FastLineRenderableSeries,
    IRenderableSeries,
    SciChartSurface,
    XyDataSeries,
    NumericAxis,
    NumberRange,
    LegendModifier,
} from "scichart";

export async function legendModifierTs(divId: string) {
    const { sciChartSurface, wasmContext } = await SciChartSurface.create(divId);

    sciChartSurface.xAxes.add(new NumericAxis(wasmContext));
    sciChartSurface.yAxes.add(new NumericAxis(wasmContext, { growBy: new NumberRange(0.05, 0.05) }));

    const xLineValues = [0, 1, 2, 3, 4, 5, 6, 7, 8];
    const yLine1Values = [0, 0.5, 1.3, 2.4, 3, 2.5, 2.2, 1.9, 1.2];
    const yLine2Values = [1, 1.1, 1.4, 1.3, 1.05, 0.8, 0.6, 0.5, 0.4];

    sciChartSurface.renderableSeries.add(new FastLineRenderableSeries(wasmContext, {
        stroke: 'red',
        strokeThickness: 3,
        dataSeries: new XyDataSeries(wasmContext, {
            dataSeriesName: 'Red Series',
            xValues: xLineValues,
            yValues: yLine1Values
        })
    }));

    sciChartSurface.renderableSeries.add(new FastLineRenderableSeries(wasmContext, {
        stroke: 'green',
        strokeThickness: 3,
        dataSeries: new XyDataSeries(wasmContext, {
            dataSeriesName: 'Green Series',
            xValues: xLineValues,
            yValues: yLine2Values
        })
    }));

    // Show the legend by adding a LegendModifier to the SciChartSurface.chartModifiers collection
    sciChartSurface.chartModifiers.add(new LegendModifier({
        showCheckboxes: true,
        showSeriesMarkers: true,
        showLegend: true
    }));
}
import { FastLineRenderableSeries, SciChartSurface, XyDataSeries, NumericAxis, NumberRange, LegendModifier, } from "scichart";
export async function legendModifierTs(divId) {
    const { sciChartSurface, wasmContext } = await SciChartSurface.create(divId);
    sciChartSurface.xAxes.add(new NumericAxis(wasmContext));
    sciChartSurface.yAxes.add(new NumericAxis(wasmContext, { growBy: new NumberRange(0.05, 0.05) }));
    const xLineValues = [0, 1, 2, 3, 4, 5, 6, 7, 8];
    const yLine1Values = [0, 0.5, 1.3, 2.4, 3, 2.5, 2.2, 1.9, 1.2];
    const yLine2Values = [1, 1.1, 1.4, 1.3, 1.05, 0.8, 0.6, 0.5, 0.4];
    sciChartSurface.renderableSeries.add(new FastLineRenderableSeries(wasmContext, {
        stroke: 'red',
        strokeThickness: 3,
        dataSeries: new XyDataSeries(wasmContext, {
            dataSeriesName: 'Red Series',
            xValues: xLineValues,
            yValues: yLine1Values
        })
    }));
    sciChartSurface.renderableSeries.add(new FastLineRenderableSeries(wasmContext, {
        stroke: 'green',
        strokeThickness: 3,
        dataSeries: new XyDataSeries(wasmContext, {
            dataSeriesName: 'Green Series',
            xValues: xLineValues,
            yValues: yLine2Values
        })
    }));
    // Show the legend by adding a LegendModifier to the SciChartSurface.chartModifiers collection
    sciChartSurface.chartModifiers.add(new LegendModifier({
        showCheckboxes: true,
        showSeriesMarkers: true,
        showLegend: true
    }));
}
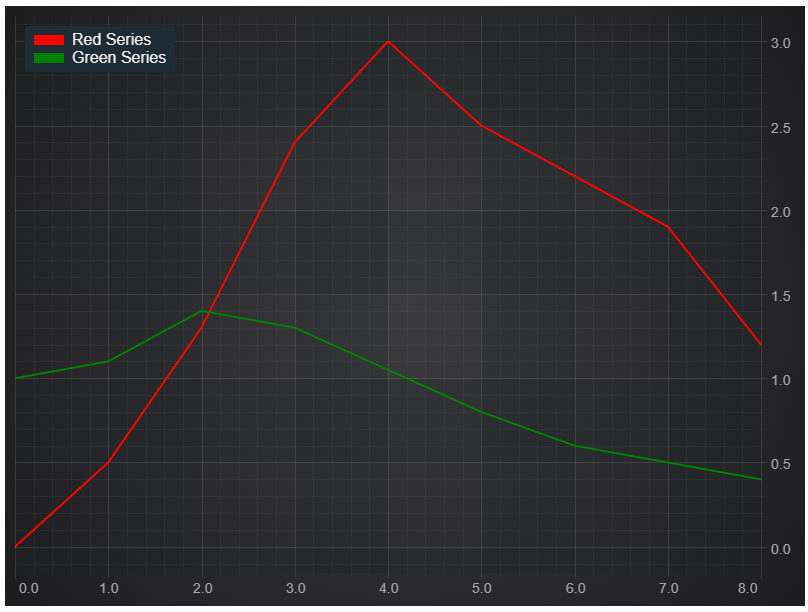
This gives us the line chart with the legend placed in the left top corner.
Showing visibility checkboxes
In order to show visibility checkboxes pass showCheckboxes📘 option into the LegendModifier constructor.
sciChartSurface.chartModifiers.add(
    new LegendModifier({
        showCheckboxes: true
    })
);
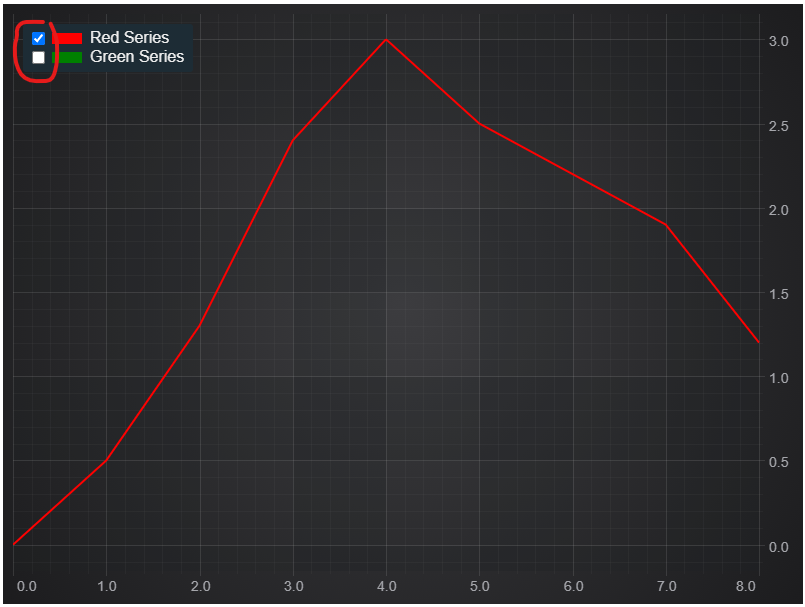
This will draw the legend with checkboxes.
Now check/uncheck the checkboxes to show/hide renderable series.
Note: the Checkbox is bound to BaseRenderableSeries.isVisible📘. You can subscribe to BaseRenderableSeries.isVisibleChanged📘 by following steps in this documentation page.
Subscribing to Checkbox Checked Changed
As well as subscribing to BaseRenderableSeries.isVisibleChanged📘, you can now subscribe to LegendModifier.isCheckedChanged📘 event. This can be done either in the constructor options to LegendModifier or after creation.
- TypeScript
- JavaScript
const legend = new LegendModifier({
    showCheckboxes: true,
    showSeriesMarkers: true,
    showLegend: true,
    // Subscribe to checked changed here
    isCheckedChangedCallback: (series: IRenderableSeries, isChecked: boolean) => {
        console.log(`Option 1: Legend item ${series.type} isChecked=${isChecked}`);
    }
});
// Or here after instantiation
legend.isCheckedChanged.subscribe((args: TCheckedChangedArgs) => {
    console.log(`Option 2: Legend item ${args.series.type} isChecked=${args.isChecked}`);
});
// Add the legend to the chart
sciChartSurface.chartModifiers.add(legend);
const legend = new LegendModifier({
    showCheckboxes: true,
    showSeriesMarkers: true,
    showLegend: true,
    // Subscribe to checked changed here
    isCheckedChangedCallback: (series, isChecked) => {
        console.log(`Option 1: Legend item ${series.type} isChecked=${isChecked}`);
    }
});
// Or here after instantiation
legend.isCheckedChanged.subscribe((args) => {
    console.log(`Option 2: Legend item ${args.series.type} isChecked=${args.isChecked}`);
});
// Add the legend to the chart
sciChartSurface.chartModifiers.add(legend);
Placing the Legend outside the chart
It is possible to place the Legend anywhere on the HTML page. In order to do that create a div element with some Id, the Id will be used to find this div element and to append the Legend. When creating the Legend pass placementDivId property into the constructor.
sciChartSurface.chartModifiers.add(new LegendModifier({ placementDivId: "legend-div-id" }));
The full example code.
- html
<div style="display: flex">
    <div id="scichart-div-id"  style="width: 800px; height: 600px;"></div>
    <div id="legend-div-id"></div>
</div>
- TypeScript
- JavaScript
import {
    FastLineRenderableSeries,
    IRenderableSeries,
    SciChartSurface,
    XyDataSeries,
    NumericAxis,
    NumberRange,
    LegendModifier,
} from "scichart";

export async function legendModifierTs(divId: string) {
    const { sciChartSurface, wasmContext } = await SciChartSurface.create(divId);

    sciChartSurface.xAxes.add(new NumericAxis(wasmContext));
    sciChartSurface.yAxes.add(new NumericAxis(wasmContext, { growBy: new NumberRange(0.05, 0.05) }));

    const xLineValues = [0, 1, 2, 3, 4, 5, 6, 7, 8];
    const yLine1Values = [0, 0.5, 1.3, 2.4, 3, 2.5, 2.2, 1.9, 1.2];
    const yLine2Values = [1, 1.1, 1.4, 1.3, 1.05, 0.8, 0.6, 0.5, 0.4];

    sciChartSurface.renderableSeries.add(new FastLineRenderableSeries(wasmContext, {
        stroke: 'red',
        strokeThickness: 3,
        dataSeries: new XyDataSeries(wasmContext, {
            dataSeriesName: 'Red Series',
            xValues: xLineValues,
            yValues: yLine1Values
        })
    }));

    sciChartSurface.renderableSeries.add(new FastLineRenderableSeries(wasmContext, {
        stroke: 'green',
        strokeThickness: 3,
        dataSeries: new XyDataSeries(wasmContext, {
            dataSeriesName: 'Green Series',
            xValues: xLineValues,
            yValues: yLine2Values
        })
    }));

    // Show the legend by adding a LegendModifier to the SciChartSurface.chartModifiers collection
    sciChartSurface.chartModifiers.add(new LegendModifier({
        placementDivId: "legend-div-id",
        showCheckboxes: true,
        showSeriesMarkers: true,
        showLegend: true,
        isCheckedChangedCallback: (series: IRenderableSeries, isChecked: boolean) => {
            console.log(`Legend item ${series.dataSeries.dataSeriesName} isChecked=${isChecked}`);
        }
    }));

}

legendModifierTs("scichart-div-id");
import { FastLineRenderableSeries, SciChartSurface, XyDataSeries, NumericAxis, NumberRange, LegendModifier, } from "scichart";
export async function legendModifierTs(divId) {
    const { sciChartSurface, wasmContext } = await SciChartSurface.create(divId);
    sciChartSurface.xAxes.add(new NumericAxis(wasmContext));
    sciChartSurface.yAxes.add(new NumericAxis(wasmContext, { growBy: new NumberRange(0.05, 0.05) }));
    const xLineValues = [0, 1, 2, 3, 4, 5, 6, 7, 8];
    const yLine1Values = [0, 0.5, 1.3, 2.4, 3, 2.5, 2.2, 1.9, 1.2];
    const yLine2Values = [1, 1.1, 1.4, 1.3, 1.05, 0.8, 0.6, 0.5, 0.4];
    sciChartSurface.renderableSeries.add(new FastLineRenderableSeries(wasmContext, {
        stroke: 'red',
        strokeThickness: 3,
        dataSeries: new XyDataSeries(wasmContext, {
            dataSeriesName: 'Red Series',
            xValues: xLineValues,
            yValues: yLine1Values
        })
    }));
    sciChartSurface.renderableSeries.add(new FastLineRenderableSeries(wasmContext, {
        stroke: 'green',
        strokeThickness: 3,
        dataSeries: new XyDataSeries(wasmContext, {
            dataSeriesName: 'Green Series',
            xValues: xLineValues,
            yValues: yLine2Values
        })
    }));
    // Show the legend by adding a LegendModifier to the SciChartSurface.chartModifiers collection
    sciChartSurface.chartModifiers.add(new LegendModifier({
        placementDivId: "legend-div-id",
        showCheckboxes: true,
        showSeriesMarkers: true,
        showLegend: true,
        isCheckedChangedCallback: (series, isChecked) => {
            console.log(`Legend item ${series.dataSeries.dataSeriesName} isChecked=${isChecked}`);
        }
    }));
}
legendModifierTs("scichart-div-id");
The result will be.
Creating Custom Legend Markers
By default, when showSeriesMarkers of the LegendModifier is set to true, all renderable series will display with a rectangle filled with the primary series color next to its name. You can override this and have custom SVG shapes as markers.
Here is how:
And here is the code doing it:
- ts
import {
    FastLineRenderableSeries,
    SciChartSurface,
    XyDataSeries,
    NumericAxis,
    NumberRange,
    LegendModifier,
    ELegendOrientation,
    TLegendItem,
    ZoomPanModifier,
    MouseWheelZoomModifier,
    XyScatterRenderableSeries,
    TrianglePointMarker,
    FastColumnRenderableSeries,
    SciChartJSLightTheme,
    SciChartJsNavyTheme
} from "scichart";

async function customLegendMarkers(divId: string) {
    const { sciChartSurface, wasmContext } = await SciChartSurface.create(divId, {
        theme: new SciChartJsNavyTheme()
    });

    sciChartSurface.xAxes.add(new NumericAxis(wasmContext));
    sciChartSurface.yAxes.add(new NumericAxis(wasmContext, { growBy: new NumberRange(0.05, 0.05) }));

    const xLineValues = [0, 1, 2, 3, 4, 5, 6, 7, 8];
    const yLine1Values = [0, 0.5, 1.3, 2.4, 3, 2.5, 2.2, 1.9, 1.2];
    const yLine2Values = [1, 1.1, 1.4, 1.3, 1.05, 0.8, 0.6, 0.5, 0.4];

    sciChartSurface.renderableSeries.add(new FastLineRenderableSeries(wasmContext, {
        id: 'green-line',
        stroke: '#00AA88',
        strokeThickness: 3,
        dataSeries: new XyDataSeries(wasmContext, {
            dataSeriesName: 'Green Line',
            xValues: xLineValues,
            yValues: yLine1Values
        })
    }));
    sciChartSurface.renderableSeries.add(new FastColumnRenderableSeries(wasmContext, {
        id: 'red-column',
        dataSeries: new XyDataSeries(wasmContext, {
            dataSeriesName: 'Red Columns',
            xValues: xLineValues,
            yValues: yLine1Values
        }),
        stroke: '#FF4433',
        fill: '#FF443344'
    }));
    sciChartSurface.renderableSeries.add(new FastLineRenderableSeries(wasmContext, {
        id: 'yellow-line-dashed',
        stroke: '#eedd00',
        strokeThickness: 3,
        strokeDashArray: [5, 5],
        dataSeries: new XyDataSeries(wasmContext, {
            dataSeriesName: 'Yellow Dashed Line',
            xValues: xLineValues,
            yValues: Array.from({ length: xLineValues.length }, (_, i) => Math.sin(i) + 1.5)
        })
    }));
    sciChartSurface.renderableSeries.add(new XyScatterRenderableSeries(wasmContext, {
        id: 'blue-triangle',
        dataSeries: new XyDataSeries(wasmContext, {
            dataSeriesName: 'Blue Triangle Series',
            xValues: xLineValues,
            yValues: yLine2Values
        }),
        pointMarker: new TrianglePointMarker(wasmContext, {
            fill: '#3388FF',
            stroke: '#FFFFFF',
            width: 13,
            height: 10,
            strokeThickness: 1.5
        }),
        stroke: '#3388FF', // needed for the legend marker
    }));

    const customMarkerLegendModifier = new LegendModifier({
        showCheckboxes: false,
        showSeriesMarkers: true,
        backgroundColor: "#00000022"
    });
    // override "getLegendItemHTML" to add custom SVG shapes
    customMarkerLegendModifier.sciChartLegend.getLegendItemHTML = (
        orientation: ELegendOrientation,
        showCheckboxes: boolean,
        showSeriesMarkers: boolean,
        item: TLegendItem
    ): string => {
        const display = orientation === ELegendOrientation.Vertical ? "flex" : "inline-flex";
        let str = `<span class="scichart__legend-item" style="display: ${display}; align-items: center; margin-right: 4px; padding: 0 4px 0 5px; white-space: nowrap; gap: 5px">`;

        if (showCheckboxes) {
            const checked = item.checked ? "checked" : "";
            str += `<input ${checked} type="checkbox" id="${item.id}">`;
        }

        if (showSeriesMarkers) {
            str += `<svg
                xmlns="http://www.w3.org/2000/svg"
                for="${item.id}"
                style="width: 15px; height: 15px;"
                viewBox="0 0 24 24"
                stroke-width="2"
            >
                ${(() => {
                    switch (item.id) {
                        case 'green-line':
                            return `<line x1="2" y1="12" x2="22" y2="12" stroke="${item.color}" stroke-width="3" />`;

                        case 'yellow-line-dashed':
                            return `<line x1="2" y1="12" x2="22" y2="12" stroke="${item.color}" stroke-width="3" stroke-dasharray="5,3" />`;

                        case 'blue-triangle':
                            return `<polygon points="12,4 21,20 3,20" fill="${item.color}" stroke="#FFFFFF" stroke-width="2.5" />`;

                        case 'red-column':
                            return `<rect x="2" y="7" width="20" height="10" fill="${item.color + "44"}" stroke="${item.color}"/>`;

                        default: // Others
                            return `<rect x="2" y="4" width="20" height="16" fill="${item.color}" stroke="${item.color}"/>`;
                    }
                })()}
            </svg>`
        }
        str += `<label for="${item.id}">${item.name}</label>`;
        str += `</span>`;
        return str;
    };

    sciChartSurface.chartModifiers.add(
        customMarkerLegendModifier,
        new ZoomPanModifier(),
        new MouseWheelZoomModifier()
    );
}

customLegendMarkers("scichart-root");