Chart Styling - Creating a Custom Theme
As well as the built-in Light and Dark theme, with SciChart.js you can also create a custom theme. To do this, you will need to pass all the properties of the IThemeProvider📘 interface to the SciChartSurface.applyTheme📘 function.
For example, the following code:
- JS
- TS
import {SciChartSurface, NumericAxis} from "scichart";

export async function createCustomTheme(divId) {
// Create a custom theme by implementing all the properties from IThemeProvider
const customTheme = {
    axisBorder: "Transparent",
    axisTitleColor: "#6495ED",
    annotationsGripsBackroundBrush: "white",
    annotationsGripsBorderBrush: "white",
    axis3DBandsFill: "#1F3D6833",
    axisBandsFill: "#1F3D6833",
    axisPlaneBackgroundFill: "Transparent",
    columnFillBrush: "white",
    columnLineColor: "white",
    cursorLineBrush: "#6495ED99",
    defaultColorMapBrush: [
        { offset: 0, color: "DarkBlue" },
        { offset: 0.5, color: "CornflowerBlue" },
        { offset: 1, color: "#FF22AA" }
    ],
    downBandSeriesFillColor: "#52CC5490",
    downBandSeriesLineColor: "#E26565FF",
    downBodyBrush: "white",
    downWickColor: "white",
    gridBackgroundBrush: "white",
    gridBorderBrush: "white",
    labelBackgroundBrush: "#6495EDAA",
    labelBorderBrush: "#6495ED",
    labelForegroundBrush: "#EEEEEE",
    legendBackgroundBrush: "#1D2C35",
    lineSeriesColor: "white",
    loadingAnimationBackground: "#0D213A",
    loadingAnimationForeground: "#6495ED",
    majorGridLineBrush: "#1F3D68",
    minorGridLineBrush: "#102A47",
    mountainAreaBrush: "white",
    mountainLineColor: "white",
    overviewFillBrush: "white",
    planeBorderColor: "white",
    rolloverLineBrush: "#FD9F2533",
    rubberBandFillBrush: "#99999933",
    rubberBandStrokeBrush: "#99999977",
    sciChartBackground: "#0D213A",
    scrollbarBackgroundBrush: "white",
    scrollbarBorderBrush: "white",
    scrollbarGripsBackgroundBrush: "white",
    scrollbarViewportBackgroundBrush: "white",
    scrollbarViewportBorderBrush: "white",
    shadowEffectColor: "white",
    textAnnotationBackground: "#6495EDAA",
    textAnnotationForeground: "#EEEEEE",
    tickTextBrush: "#6495ED",
    upBandSeriesFillColor: "white",
    upBandSeriesLineColor: "white",
    upBodyBrush: "#6495EDA0",
    upWickColor: "#6495ED"
}
const { sciChartSurface, wasmContext } = await SciChartSurface.create(divId);
sciChartSurface.applyTheme(customTheme);
sciChartSurface.xAxes.add(new NumericAxis(wasmContext));
sciChartSurface.yAxes.add(new NumericAxis(wasmContext));
}
import {SciChartSurface, NumericAxis, IThemeProvider} from "scichart";

export async function createCustomThemeTs(divId: string) {
// Create a custom theme by implementing all the properties from IThemeProvider
const customTheme: IThemeProvider = {
    axisBorder: "Transparent",
    axisTitleColor: "#6495ED",
    annotationsGripsBackroundBrush: "white",
    annotationsGripsBorderBrush: "white",
    axis3DBandsFill: "#1F3D6833",
    axisBandsFill: "#1F3D6833",
    axisPlaneBackgroundFill: "Transparent",
    columnFillBrush: "white",
    columnLineColor: "white",
    cursorLineBrush: "#6495ED99",
    defaultColorMapBrush: [
        { offset: 0, color: "DarkBlue" },
        { offset: 0.5, color: "CornflowerBlue" },
        { offset: 1, color: "#FF22AA" }
    ],
    downBandSeriesFillColor: "#52CC5490",
    downBandSeriesLineColor: "#E26565FF",
    downBodyBrush: "white",
    downWickColor: "white",
    gridBackgroundBrush: "white",
    gridBorderBrush: "white",
    labelBackgroundBrush: "#6495EDAA",
    labelBorderBrush: "#6495ED",
    labelForegroundBrush: "#EEEEEE",
    legendBackgroundBrush: "#1D2C35",
    lineSeriesColor: "white",
    loadingAnimationBackground: "#0D213A",
    loadingAnimationForeground: "#6495ED",
    majorGridLineBrush: "#1F3D68",
    minorGridLineBrush: "#102A47",
    mountainAreaBrush: "white",
    mountainLineColor: "white",
    overviewFillBrush: "white",
    planeBorderColor: "white",
    rolloverLineBrush: "#FD9F2533",
    rubberBandFillBrush: "#99999933",
    rubberBandStrokeBrush: "#99999977",
    sciChartBackground: "#0D213A",
    scrollbarBackgroundBrush: "white",
    scrollbarBorderBrush: "white",
    scrollbarGripsBackgroundBrush: "white",
    scrollbarViewportBackgroundBrush: "white",
    scrollbarViewportBorderBrush: "white",
    shadowEffectColor: "white",
    textAnnotationBackground: "#6495EDAA",
    textAnnotationForeground: "#EEEEEE",
    tickTextBrush: "#6495ED",
    upBandSeriesFillColor: "white",
    upBandSeriesLineColor: "white",
    upBodyBrush: "#6495EDA0",
    upWickColor: "#6495ED"
}
const { sciChartSurface, wasmContext } = await SciChartSurface.create(divId);
sciChartSurface.applyTheme(customTheme);
sciChartSurface.xAxes.add(new NumericAxis(wasmContext));
sciChartSurface.yAxes.add(new NumericAxis(wasmContext));
}
Results in this output:
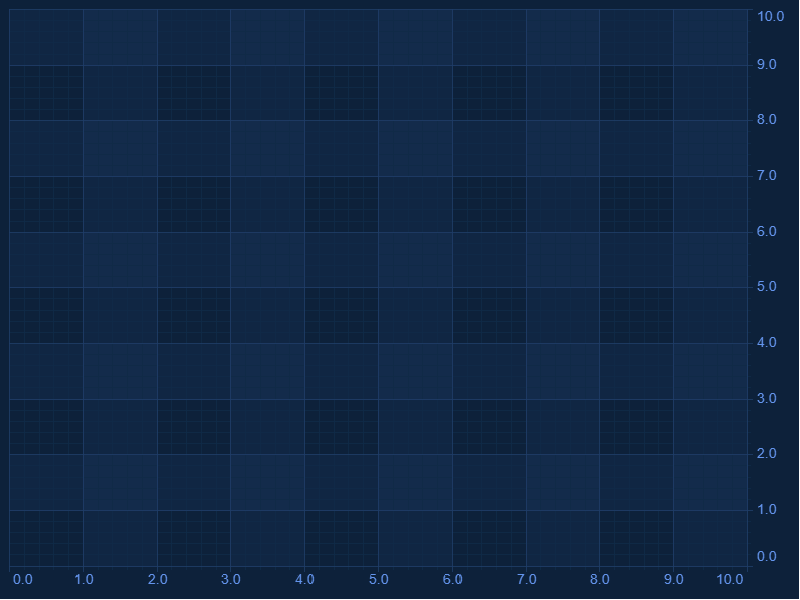
All colors in SciChart.js are strings, which are HTML color codes. Supported values are 6-digit hex codes e.g. "#ADFF2F", 8-digit hex codes in RGBA format where the last two digits are opacity e.g. "#AAFF2F33" and rgba CSS color codes e.g. "rgba(173, 255, 47, 0.3)"
You can see an example live of creating a custom theme over at the SciChart.js Examples Suite.
Inheriting a Built-In Theme
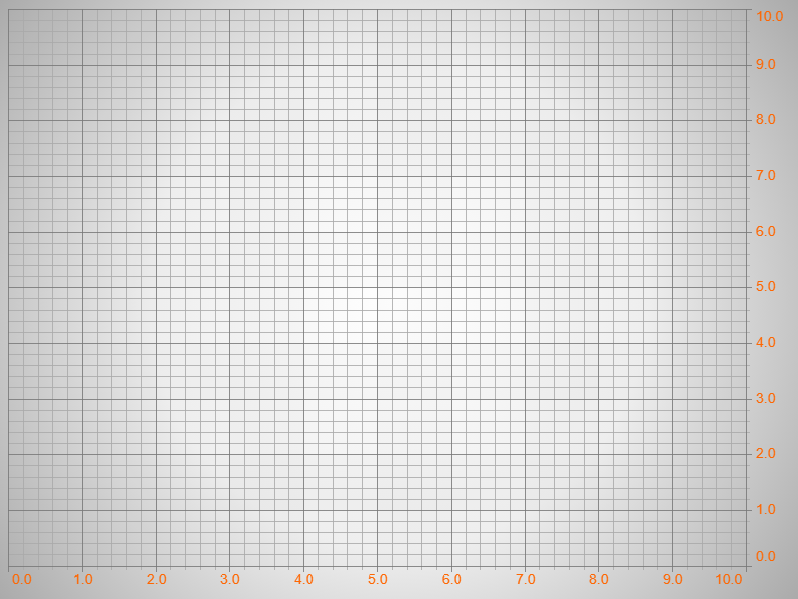
If you want to create a custom theme built on one of the default themes supplied with SciChart.js, you can use the JavaScript spread operator. For example. Say you wanted to base a theme on SciChartJSLightTheme but change the background to a gradient background and override gridline colours, use code like this:
// Inheriting Themes
import {
    SciChartSurface,
    NumericAxis,
    SciChartJSLightTheme
} from "scichart";

export async function inheritThemeGradientBackground(divId) {
    // Create a theme and inherit / override some properties
    const myTheme = { ...new SciChartJSLightTheme() };

    // Override axis text label
    myTheme.tickTextBrush = "#ff6600";

    // Override gridlines
    myTheme.majorGridLineBrush = "#777";
    myTheme.minorGridLineBrush = "#aaa";

    // Override background with a gradient
    myTheme.sciChartBackground =
        "radial-gradient(circle, #ffffff 0%, #eeeeee 50%, #AAAAAA 100%)";

    // Apply theme
    const { sciChartSurface, wasmContext } = await SciChartSurface.create(divId, {
        theme: myTheme
    });
    sciChartSurface.xAxes.add(new NumericAxis(wasmContext));
    sciChartSurface.yAxes.add(new NumericAxis(wasmContext));
}
This results in the following custom theme, based off one of our themes: