Tutorial 02 - Creating a Chart with scichart-react
In this tutorial, we'll show how to create a JavaScript chart in React using scichart.js and scichart-react.
The previous tutorial Tutorial 01 - Understanding the scichart-react boilerplate serves as a reference. We'll use that boilerplate (npm setup, webpack config, package.json) as a starting point.
Copy the boilerplate to a new folder or project. You can get the code from: Boilerplates/scichart-react.
The <SciChartReact /> React Component
Props and Configuration
<SciChartReact /> has the following props:
| Name | Description |
|---|---|
| fallback | ReactNode rendered while the chart is initializing |
| onInit | Callback function after the chart is initialized |
| onDelete | Callback function when the chart is unmounted |
| innerContainerProps | Props passed to the inner container <div> hosting the chart |
| initChart | Function accepting an HTMLDivElement and returning a SciChartSurface instance |
| config | Chart definition as a JSON object or string compatible with the Builder API |
| style | Optional styles applied to the outer <div> |
At a minimum, pass either initChart (programmatic JS API) or config (Builder API) to <SciChartReact />.
You can also specify fallback, onInit, and onDelete, and style the chart via style and innerContainerProps.
DOM Outputted by <SciChartReact />
Each <SciChartReact /> outputs three <div> elements:
<div> <!-- outer div, style applied here -->
  <div> <!-- innerContainerProps applied here -->
    <div id="scichart-root"> <!-- Chart hosted here -->
    </div>
  </div>
</div>
Example usage:
<SciChartReact
  initChart={initChartFunc} // (divElement) => { return { sciChartSurface }; }
  onInit={onInitFunc} // (initResult) => console.log(`surface: ${initResult.sciChartSurface.id}`);
  onDelete={onDeleteFunc} // (initResult) => console.log(`surface: ${initResult.sciChartSurface.id}`);
  innerContainerProps={{ style: { width: "100%" } }}
  style={{ maxWidth: 900, height: 600 }}
/>
Creating a scichart-react Chart Using initChart
Copy the Boilerplates/scichart-react folder into a new project. Change your App.jsx as follows:
- App.jsx
import React from "react";
import { SciChartReact } from "scichart-react";
function App() {
return (
<div className="App">
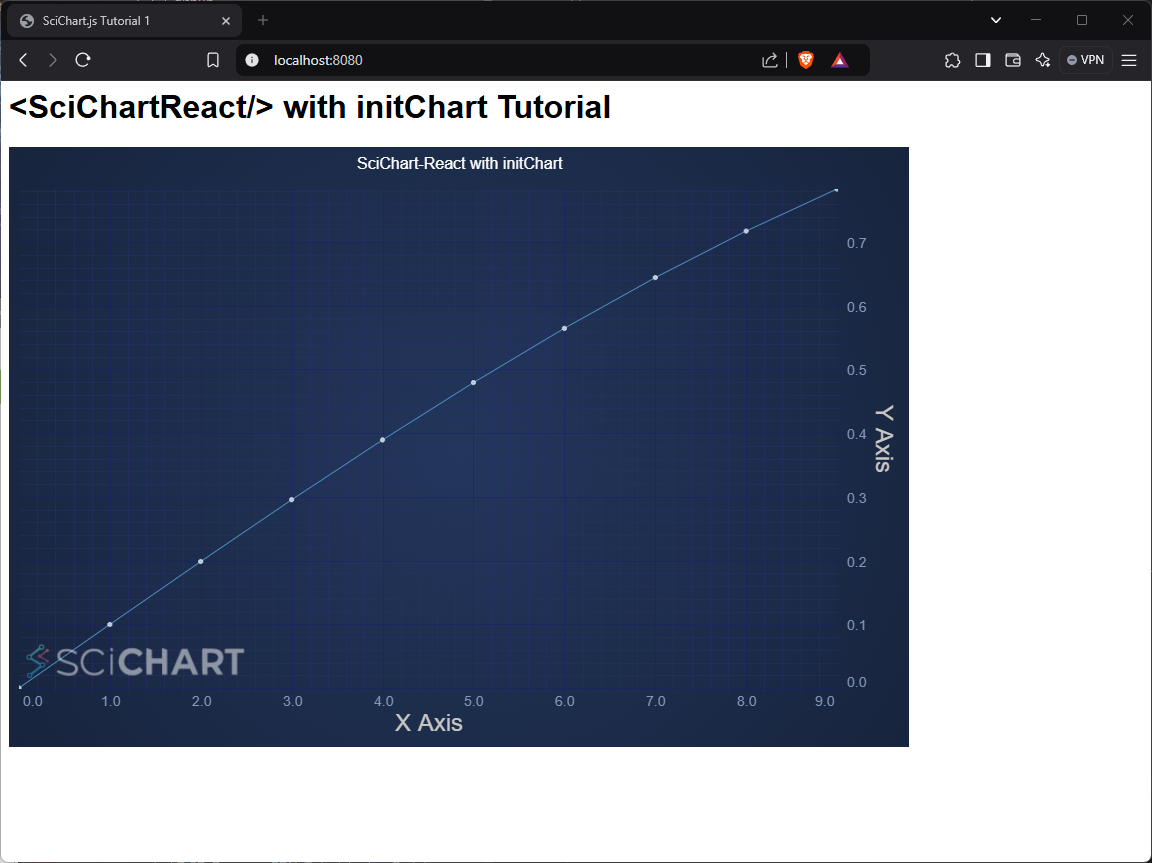
<header className="App-header">
<h1><SciChartReact/> with initChart Tutorial</h1>
</header>
<SciChartReact
initChart={initChart}
onInit={onInit}
onDelete={onDelete}
innerContainerProps={{ style: { width: "100%" } }}
style={{ maxWidth: 900, height: 600 }}
/>
</div>
);
}
export default App;
The <SciChartReact /> component renders a single chart. initChart sets up the chart, onInit/onDelete handle mount/unmount events, and innerContainerProps/style control the layout.
Initialization Code
- TS
import {
  SciChartSurface,
  SciChartJsNavyTheme,
  NumericAxis,
  FastLineRenderableSeries,
  XyDataSeries,
  EllipsePointMarker,
  ZoomPanModifier,
  MouseWheelZoomModifier,
  ZoomExtentsModifier,
  SweepAnimation,
} from "scichart";

const initChart = async (rootElement) => {
  const { sciChartSurface, wasmContext } = await SciChartSurface.create(rootElement, {
    id: "New SciChart Chart",
    theme: new SciChartJsNavyTheme(),
    title: "SciChart-React with initChart",
    titleStyle: { fontSize: 16, color: "White" },
  });

  sciChartSurface.xAxes.add(new NumericAxis(wasmContext, { axisTitle: "X Axis" }));
  sciChartSurface.yAxes.add(new NumericAxis(wasmContext, { axisTitle: "Y Axis" }));

  sciChartSurface.renderableSeries.add(
    new FastLineRenderableSeries(wasmContext, {
      dataSeries: new XyDataSeries(wasmContext, {
        xValues: [0, 1, 2, 3, 4, 5, 6, 7, 8, 9],
        yValues: [0, 0.0998, 0.1986, 0.2955, 0.3894, 0.4794, 0.5646, 0.6442, 0.7173, 0.7833],
      }),
      stroke: "SteelBlue",
      pointMarker: new EllipsePointMarker(wasmContext, {
        fill: "LightSteelBlue",
        stroke: "White",
        size: 9,
      }),
      animation: new SweepAnimation({ duration: 750 }),
    })
  );

  sciChartSurface.chartModifiers.add(
    new ZoomPanModifier({ enableZoom: true }),
    new MouseWheelZoomModifier(),
    new ZoomExtentsModifier()
  );

  return { sciChartSurface };
};

const onInit = (initResult) => {
  const sciChartSurface = initResult.sciChartSurface;
  console.log(`SciChartSurface initialized: id=${sciChartSurface.id}`);
};

const onDelete = (initResult) => {
  const sciChartSurface = initResult.sciChartSurface;
  console.log(`SciChartSurface deleted: id=${sciChartSurface.id} isDeleted=${sciChartSurface.isDeleted}`);
};
Running the Code
The full source code is available at SciChart.JS.Examples Tutorials/React/Tutorial_02.
This version:
- Uses Docusaurus-friendly code blocks and
<CodeSnippetBlock>for JS/TS snippets. - Replaces raw HTML
<div>descriptions with code blocks. - Adds
tipandwarningcallouts. - Keeps headings structured for readability.
- Cleans up redundant text and fixes grammar.