Style Transition Animations
SciChart.js v2.x and above features a new API which allows you to animate style properties on different series types. This is useful if you want to provide feedback on mouse-click such as data-point selection or series selection.
Style Animation Types
Style animations allow changing series styles like color, stroke thickness, point marker size, etc. These differ from series to series so there is a specific type to animate the properties of each series in SciChart.js.
Style animation types per-series are as follows:
- LineAnimation📘
- BandAnimation📘
- BubbleAnimation📘
- OhlcAnimation📘
- ColumnAnimation📘
- MountainAnimation📘
- ScatterAnimation📘
Worked Examples
Animating PointMarkers in a Scatter Series
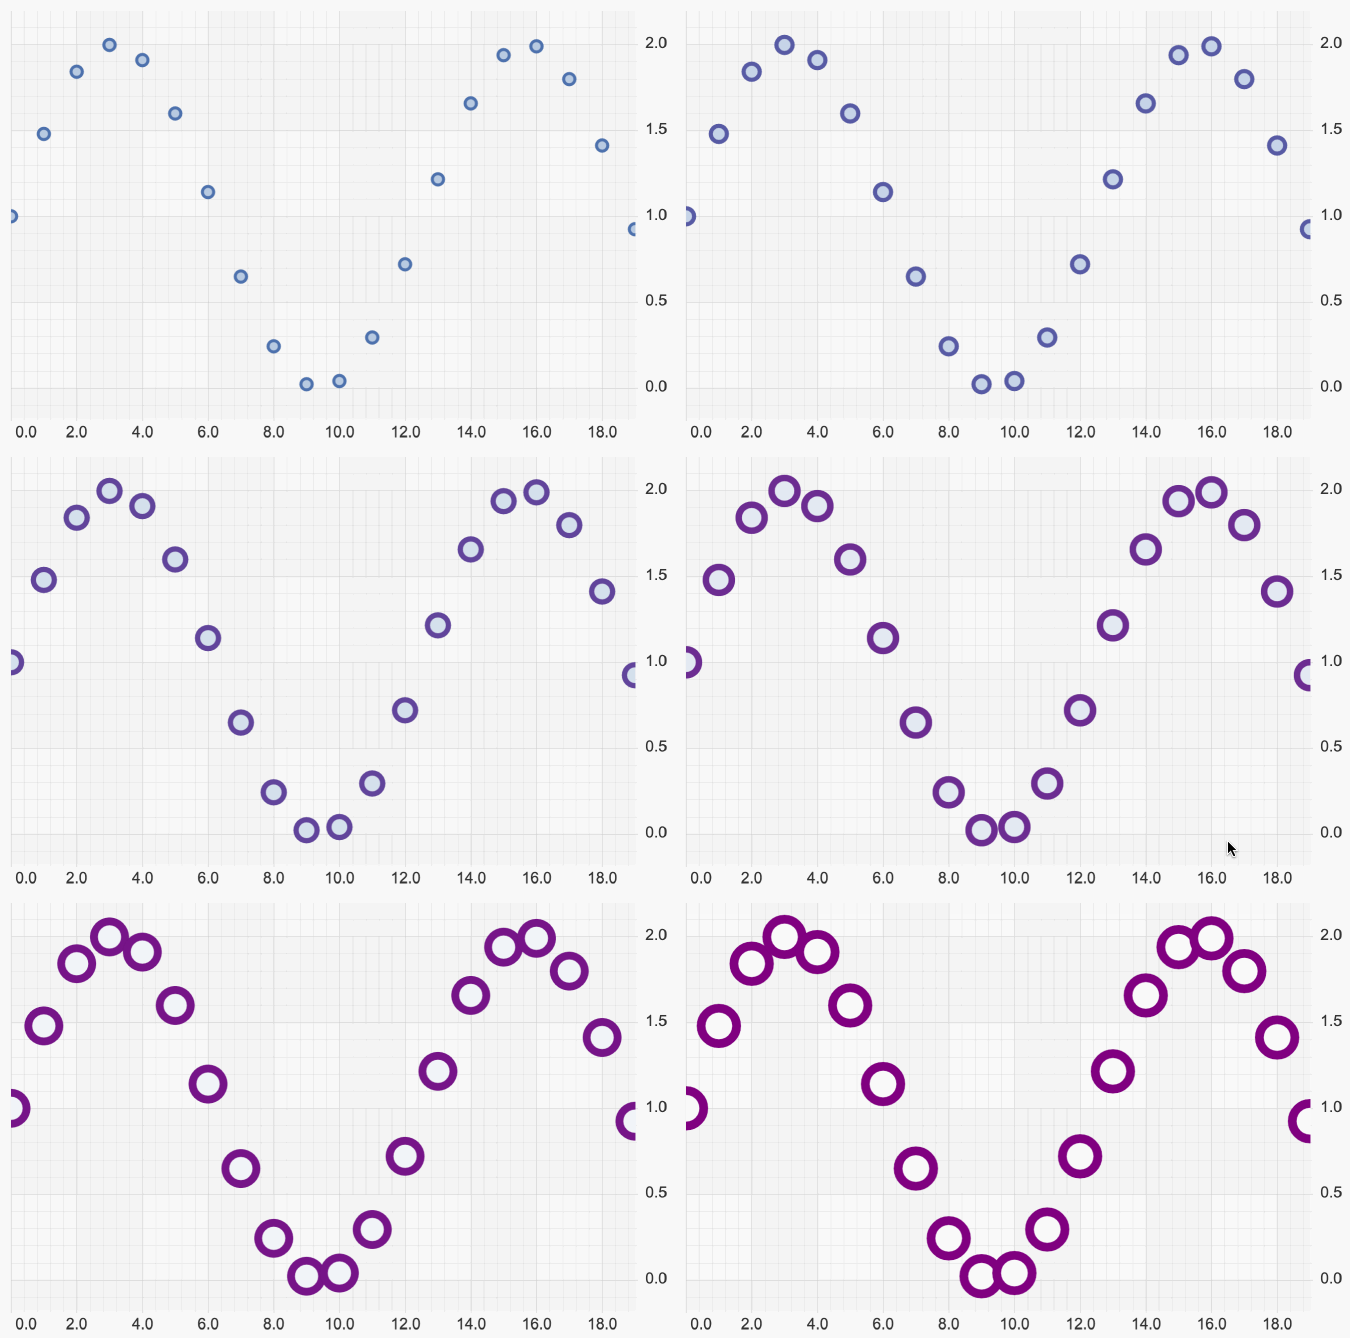
The following example will create a style animation for ellipse point marker:
// Pointmarker Animation

const { sciChartSurface, wasmContext } = await SciChartSurface.create(divElementId, {
    theme: new SciChartJSLightTheme()
});
sciChartSurface.xAxes.add(new NumericAxis(wasmContext));
sciChartSurface.yAxes.add(new NumericAxis(wasmContext, { growBy: new NumberRange(0.1, 0.1) }));
const scatterSeries = new XyScatterRenderableSeries(wasmContext, {
    pointMarker: new EllipsePointMarker(wasmContext, {
        width: 9,
        height: 9,
        strokeThickness: 2,
        fill: "LightSteelBlue",
        stroke: "steelblue"
    })
});
sciChartSurface.renderableSeries.add(scatterSeries);
const dataSeries = new XyDataSeries(wasmContext);
for (let i = 0; i < 20; i++) {
    dataSeries.append(i, Math.sin(i \* 0.5) + 1);
}
scatterSeries.dataSeries = dataSeries;
const pointMarkerAnimation = new ScatterAnimation({
    duration: 3000,
    styles: {
        pointMarker: {
            type: EPointMarkerType.Ellipse,
            width: 40,
            height: 40,
            strokeThickness: 8,
            stroke: "Purple",
            fill: "White"
        }
    }
});
scatterSeries.enqueueAnimation(pointMarkerAnimation);
sciChartSurface.zoomExtents();
This results in animating the pointmarker size, stroke and fill on a scatter series: